Overview
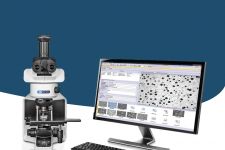
Image Capture and Hardware SupportAll supported cameras—color, monochrome, IR, SWIR—are integrated into the software’s easy-to-use camera control, which also captures the magnification and calibration information. Acquiring large, all-in-focus images is easy using either a manual or motorized stage. Measurement, Image Analysis, and Optional Advanced Imaging SolutionsThe software enables you to make a variety of geometric measurements interactively or with advanced image processing and analysis capabilities. Standard compliant measurements can also be produced using the Material Solutions workflow. The software offers a variety of tools for various materials science analyses, so you can be confident in your results. Data Storage and SharingThe data are securely stored on the local network using client-server technology based on Microsoft SQL Server. User rights and data security can be enhanced with the Secure File Repository package. DocumentationPowerful reporting tools are available that use Microsoft 365 with a direct connection to the database. Try Stream Enterprise free for 30 days! Click "Request a Demo" and note that you would like a 30-day license in the first box. Easy-to-Use Interface and Step-by-Step GuidanceSmart Technologies for Crisp Image Capture
High Efficiency on Repeating Tasks
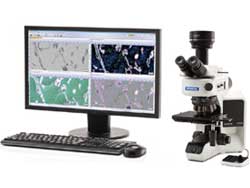
Designed for Olympus HardwareSeamlessly Integration with Olympus Optical Microscopes
Working with Olympus Digital Cameras
Dedicated Observation Methods
Solving Your Inspection ChallengesAdvanced Imaging Solutions
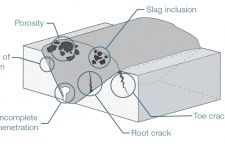
Solutions for Metallography
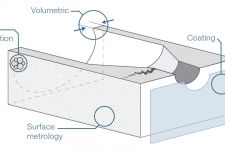
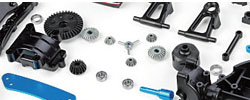
Solutions for Machinery Processing (Automotive / Machined Parts Industries)
Solutions for Electronics (Electronic Device / Semiconductor Industries)
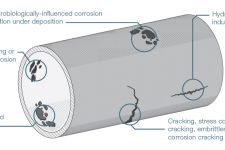
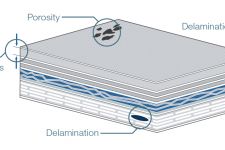
Solutions for Surface Coatings and Thin Film Deposits (Coating Industries)
|


Smart Technology
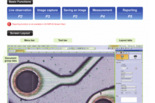
Step-by-Step GuidanceThe dynamic user interface reduces desktop clutter and confusion by only displaying the tools and functions you want to use. The interface guides you through every step of the process, including image capture, image processing, and report creation. Both simple and complex measurements can be easily conducted using the software’s intuitive set of tools.
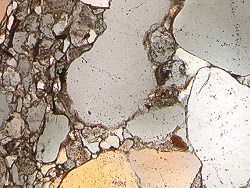
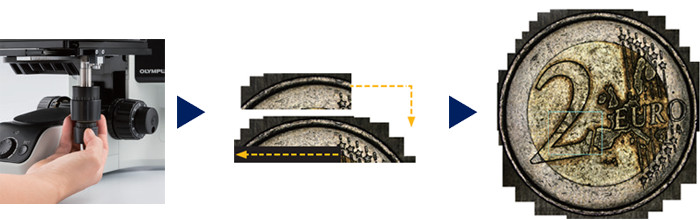
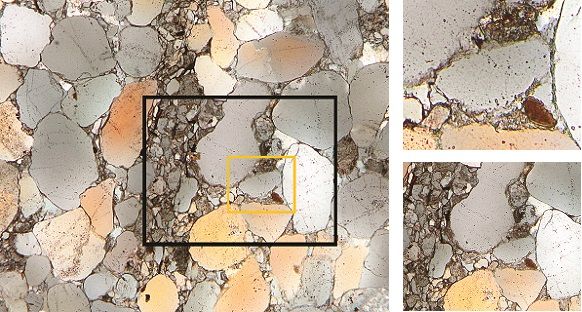
Fast Panorama and Extended Depth FocusQuickly create images of samples that extend beyond the standard depth of focus or the field of view. The instant extended focus image (EFI) function uses the fine focus adjustment to combine many images taken at different Z-levels to build a single combined image that is entirely in focus. Instant multiple image alignment (MIA) makes it easy to create panoramic images simply by moving the XY stage; a motorized stage is no longer necessary.
Instant EFI image of crystal: fully focused image is created even in low-contrast sample areas
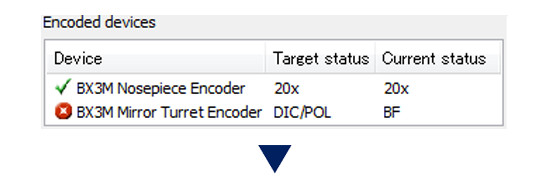
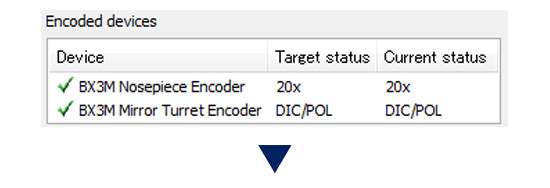
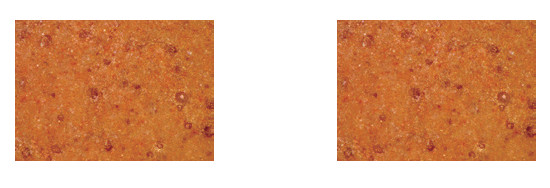
Instant MIA image of a coin Recall Acquisition SettingQuickly recall previously used camera settings to capture repeatable images with a consistent look and feel. When using a motorized microscope, this function can automatically recall previous hardware settings. If you’re using a BX, GX, or MX series microscope, the software guides you to manually recall settings.
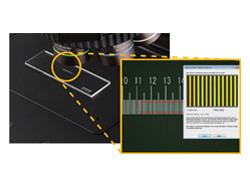
Automated Inspection ToolsThe software’s automated tools can create a very large set of data in just a few minutes. Automatic magnification calibration using a calibrated grating reticle helps ensure that your images are displayed with the proper scale bar and that your measurements are confirmed. Large areas can be imaged automatically using motorized XYZ stages, enabling the creation of images of large parts with high resolution.
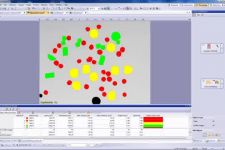
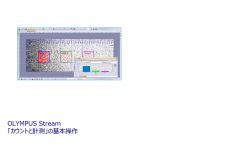
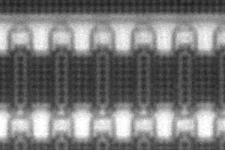
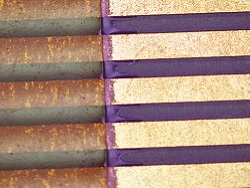
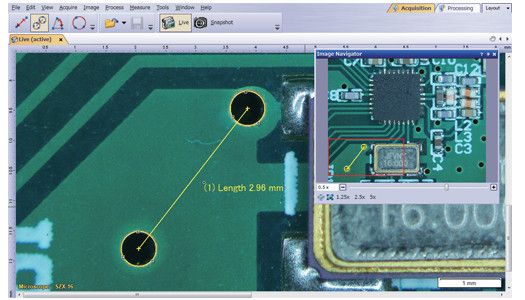
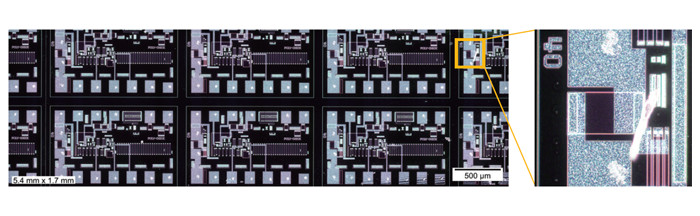
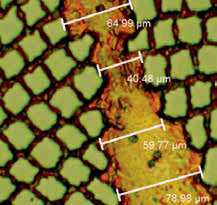
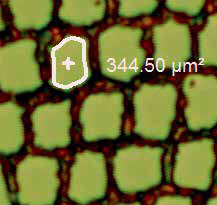
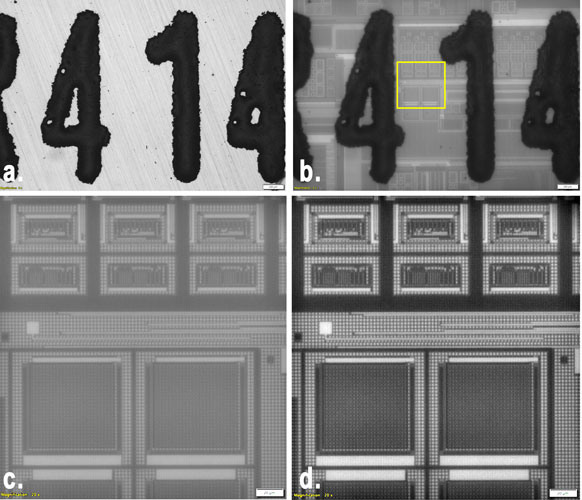
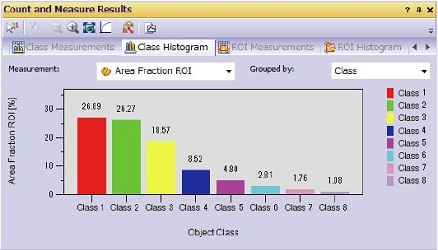
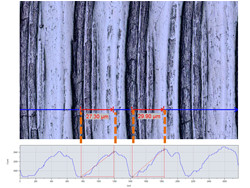
Sharp and high-contrast MIA image of integrated circuit (IC) pattern (dark field observation with 20X objective lens) Quantitative Information that MattersThe software tools features quantitative information about your sample. Interactive measurements on live and still images provide the basic dimensional information (length, area, and diameter), and the results are directly visible on the image. Advanced interactive measurements include the magic wand and complex polygonal shapes for semiautomatic area measurement, while the count and measure solution provides access to more than a one hundred single particle parameters for quantitative analysis based on the threshold method.
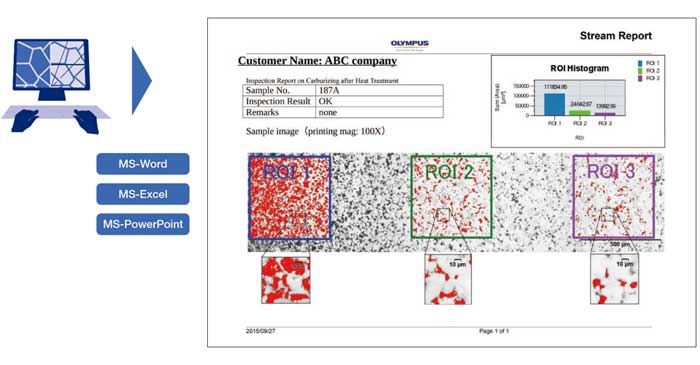
Efficient Report CreationCreating a report often takes longer than capturing the image and taking the measurements. With the software, you can repeatedly produce smart and sophisticated reports based on predefined templates. Editing is simple, and reports can be exported to Microsoft Word, Excel, or PowerPoint. In addition, the software’s reporting tool enables digital zooming and magnification on acquired images. Report files are a reasonable size for easier data exchange by email.
Professional report that summarizes particle counting data Integrated Data ManagementStream Enterprise’s data management software enables workflows with large amounts of data and many users to run efficiently with a high level of data security.
User RightsThere are four user rights roles: administrator, power user, user, and guest. Each can be custom modified for more flexibility. In addition, you can assign access rights for each project or data record to defined individuals or members of a group. Authentication is possible via SQL logon when starting Stream Enterprise or via integration with an existing active directory and lightweight directory access protocol (LDAP) to provide single sign-on (SSO) capabilities. Secure File RepositoryFor additional data security, Stream Enterprise offers the optional secure file repository (SFR) package. As an extra layer of security, the SFR works with Stream Enterprise to handle file requests based on a user’s access permission; users without permission to open a file will not see it in their file directory. IntegrationStream Enterprise can be set up to interface directly with existing order management, LIMS, ERP, and CRM systems. For additional flexibility, the software has available built-in interfaces to digital communication protocols, such as component object model (COM) and open database connectivity (ODBC), which enable easier interfacing with other programs. Application programming interface (API) functionality has also been added to enable the use of Stream Enterprise processes by other programs. Access to Existing DatabasesExisting records from other databases can be imported into Stream Enterprise with all the relevant data and metadata properly organized. It is also possible to use some existing data sources without importing them (read-only access). | ||||||||||||||||||||||||||||
Your System
Customize Your Software PackageDeveloped for our microscopes, Stream Enterprise data management software is a powerful and user-friendly measurement tool. There is no need to manually record the optical parameters of UIS2 objectives when using it with a conventional microscope. Magnification calibration is also not required when importing images from our DSX and LEXT microscopes. The software is available from entry-level to advanced packages. OLYMPUS Stream Packages
OLYMPUS Stream software is available in four packages based on functionality—Start, Basic, Essentials, and Motion.
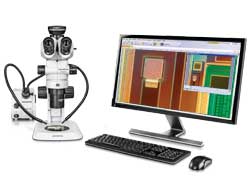
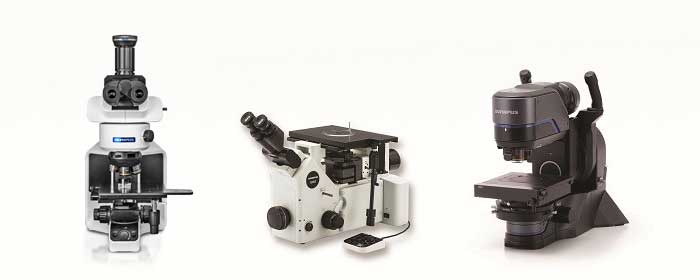
Seamlessly Integrates with Most Evident Optical MicroscopesControl Upright Microscopes
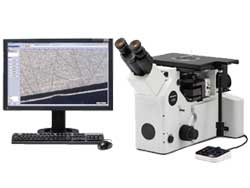
Control Inverted Microscopes
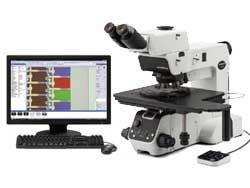
Control Semiconductor Microscopes
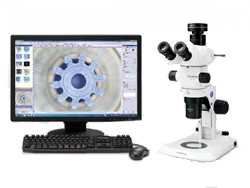
Control Stereo Microscopes
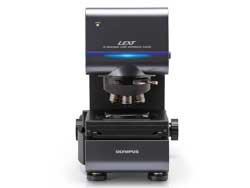
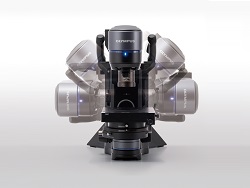
Enhance the Power of Evident Confocal and Digital MicroscopesUse Stream Enterprise Data management software for post-processing (Stream Enterprise Desktop) with the complete range of DSX series digital microscopes and the LEXT 3D measuring laser microscope.
View the LEXT 3D Measuring Laser Microscope Supports Most Evident Digital CamerasResolution and Color Fidelity
Reveal More with Infrared (IR)
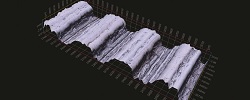
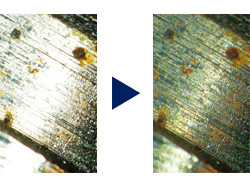
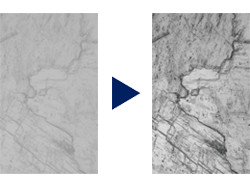
Dedicated Observation Methods for Materials ScienceHDR imaging for enhanced contrastHigh dynamic range (HDR) imaging improves image contrast in difficult conditions (very bright areas together with very dark areas in the same image). All cameras supported by Stream Enterprise data management software can be used in this mode, and dedicated cameras have an available live mode.
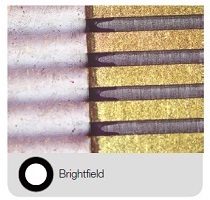
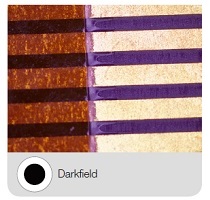
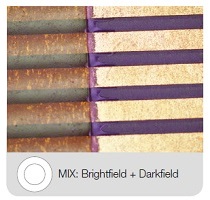
MIX observation to visualize sample’s surface structureThe software supports our MIX observationThis illumination technique combines directional darkfield, which uses a circular LED to illuminate one or more quadrants at a given time, , and brightfield, fluorescence, or polarization, enabling you to highlight defects and differentiate raised surfaces from depressions that are normally difficult to see with conventional microscopes. MIX observation helps reduce a sample’s halation and is useful for visualizing a sample’s surface texture.
| ||||||||||||||||||||||||
Solutions
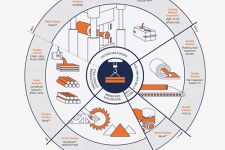
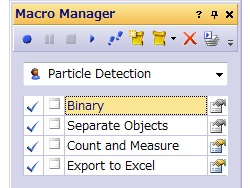
Solving Your Inspection ChallengesIndustrial labs often require repeatable and reproducible results as part of their standard operating procedures. Stream Enterprise Data Management software facilitates inspection, measurement, and analysis with a simple and reliable workflow. The software offers a variety of tools for various materials science analyses, so you can be confident in your results.
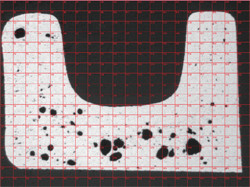
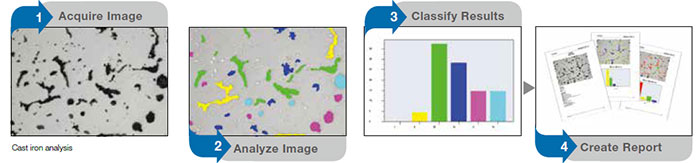
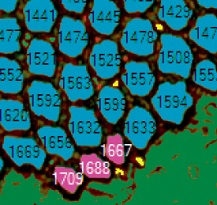
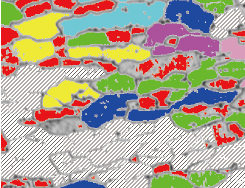
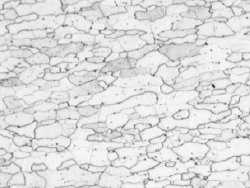
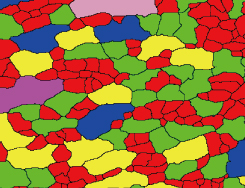
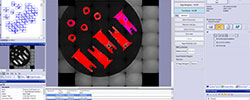
Evident industrial microscopes support metallurgical analysis solutions Count and Measure SolutionThe software’s count and measure solution uses advanced threshold methods to reliably separate objects, such as particles and scratches, from the background. More than 50 different object measurement and classification parameters are available, including shape, size, position, and pixel properties.
Grain classification results Efficient Analysis
Powerful Image Filters
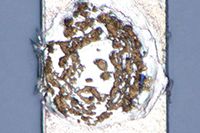
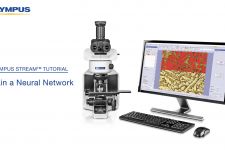
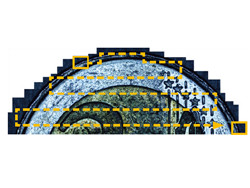
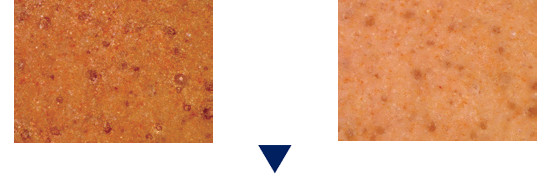
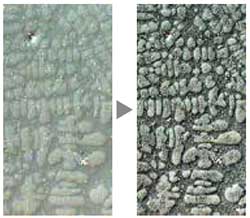
TruAI™ Deep-Learning TechnologyImage segmentation using conventional threshold methods that depend on brightness or color can miss critical information or targets in samples. The Stream Enterprise data management TruAI solution offers a more accurate segmentation approach using deep-learning technology for a highly reproducible and robust analysis, including instance segmentation to split an image into individual instances of an object.
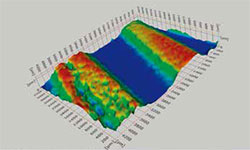
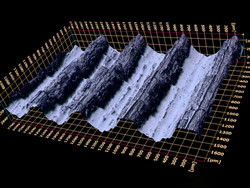
Learn more about TruAI deep learning  Original image of brown coal ash fly (left) in OLYMPUS Stream/PRECiV, image segmentation using conventional thresholding methods (right). Original image of brown coal ash fly (left) in OLYMPUS Stream/PRECiV, deep-learning image segmentation (right). Three-Dimensional Measurement and Line ProfilesThe Stream Enterprise Data management 3D solution provides coded and motorized Z control and instant EFI with height mapping capabilities to measure a three-dimensional sample.
Solutions for Metallography
Solutions for Machinery Processing (Automotive / Machined Parts Industries)
Solutions for Electronics (Electronic Device / Semiconductor Industries)
Solutions for Surface Coatings and Thin Film Deposits (Coating Industries)
Custom Workflow Solutions
Materials Solutions for Every Purpose
|
Specifications
Main License Specifications
*1 Requires the DP74 camera, and the Live HDR function requires 64-bit OS.
Special Solution Specifications
* Not possible to use the functions relating to image acquisition Materials Solutions Specifications
| ||||||||||||||||||||||||||||||||||||||||||||||||||||||||||||||||||||||||||||||||||||||||||||||||||||||||||||||||||||||||||||||||||||||||||||||||||||||||||||||||||||||||||||||||||||||||||||||||||||||||||||||||||||||||||||||||||||||||