Straight Beam Linear scans
Straight beam linear scans are usually easy to conceptualize on a display because the scan image typically represents a simple cross-sectional view of the test piece. As described in Section 3.7, a phased array system uses electronic scanning along the length of a linear array probe to create a cross-sectional profile without moving the transducer. As each focal law is sequenced, the associated A-scan is digitized and plotted. Successive apertures are "stacked", creating a live cross sectional view. The effect is similar to a B-scan presentation created by moving a conventional single element transducer across a test piece and storing data at selected intervals.
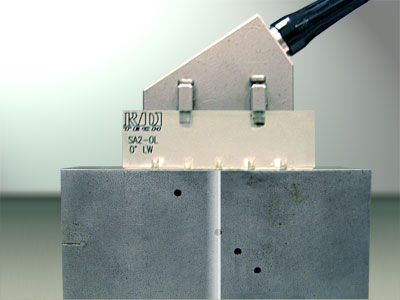
In practice, this electronic sweeping is done in real time so a live part cross section can be continually viewed as the transducer is physically moved. The actual cross section represents the true depth of reflectors in the material as well as the actual position typically relative to the front of the probe assembly. Below is an image of holes in a test block made with a 5L64-A2, 64-element 5 MHz linear phased array probe. The probe has a 0.6mm pitch.
In this example, the user programmed the focal law to use 16 elements to form an aperture and sequenced the starting element increments by one. So aperture 1 consists of elements 1 through16, aperture 2 from elements 2 through 17, aperture 3 from elements 3 through18, and so on. This results in 49 individual waveforms that are stacked to create the real time cross-sectional view across the transducer's length.
The result is an image that clearly shows the relative position of the holes within the scan area, along with the A-scan waveform from a single selected aperture, in this case the 29th aperture out of 49, formed from elements 29-45, is represented by the user-controlled blue cursor. This is the point at which the beam intersects the second hole.
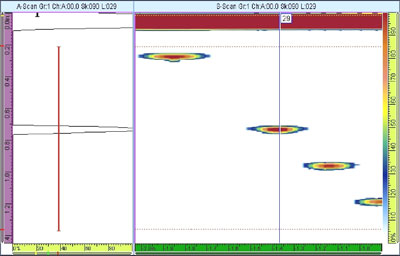
The vertical scale at the left edge of the screen indicates the depth or distance to the reflector represented by a given peak in the A-scan. The horizontal scale of the A-scan indicates relative echo amplitude. The horizontal scale under the scan image shows reflector position with respect to the leading edge of the probe, while the color scale on the right edge of the screen relates image color to signal amplitude.
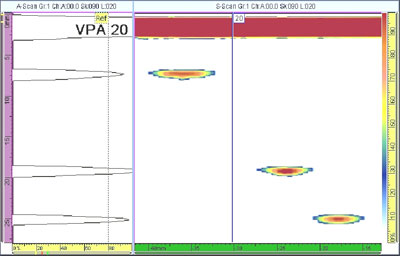
Alternately, the instrument can be set to display an "all laws" A-scan, which is a composite image of the waveforms from all apertures. In this case, the A-scan includes the indications from all four holes within the gated region. This is particularly useful mode in zero degree inspections, although it can also be confusing when working with complex geometries that produce numerous echoes. In the example below, the first three screens show views in which the A-scan display depicts the waveform from a single virtual probe aperture in the scan, each of which is centered over one of the reference holes.


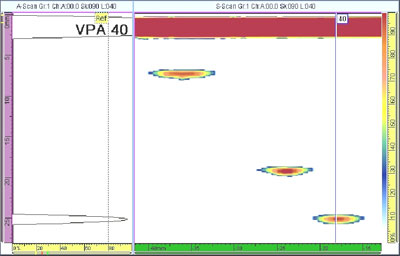
This fourth screen shows an all laws A-scan in which the signals from all apertures is summed, thus showing all three hole indications simultaneously.
Yet another A-scan source mode on some more advanced instruments allows the A-scan to be sourced from the first or maximum signal within the gated region.
Continue on to
Angled Linear Scans>>