Using a Laser Microscope to Measure Beyond Rz (Maximum Height) Roughness
Analyzing the surface roughness of copper foil on a printed circuit board used for 5G
The rapid spread of mobile phones has driven innovation in mobile communication systems such that the system undergoes a major technological overhaul approximately every ten years. This evolution began in the 1980s with the first mobile communication system (1G) using analog mobile phones. The second generation (2G) brought email and the Internet to mobile phones, while the third generation (3G) provided high-speed, large capacity communications. The fourth generation (4G) brought even higher speeds and larger capacities that enabled mobile phones to become platforms for watching videos and playing games. In 2020, we entered the fifth generation, or 5G.
5G technology enables ultra-high speeds and ultra-large capacities. In addition, it facilitates multiple simultaneous connections for up to 1 million devices per square kilometer (compared to a hundred thousand devices per square kilometer for 4G) with a low latency of 0.001 seconds (compared to 0.01 seconds for 4G). 5G will have a wide variety of internet of things (IoT) applications, such as video distribution with large-capacity communications and autonomous driving that makes use of the low latency, as well as conventional services for mobile devices, such as smartphones.
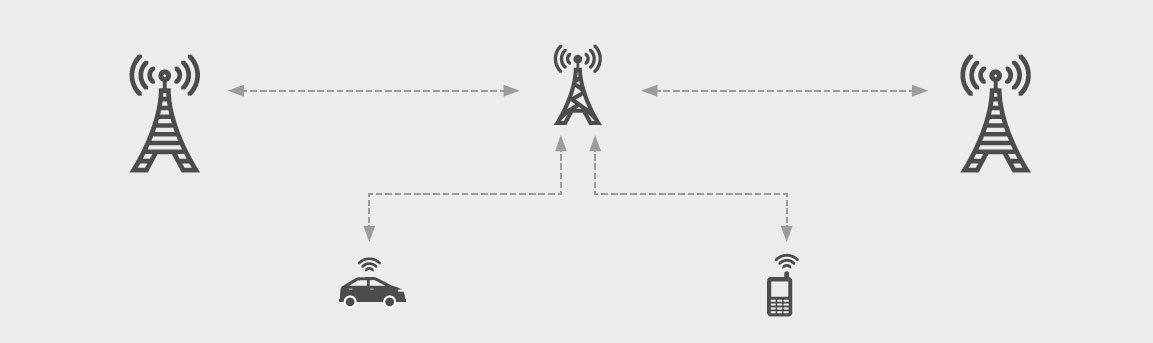
5G network illustration
5G technology uses higher frequencies than 4G. As the signal frequencies rise, the electronic devices that make up the network must be able to maximize the transmission of high-frequency signals. To do this, the devices have various technological adaptations. In this app note, we focus on one adaptation—the roughness of the copper foil used in the devices’ printed circuit boards (PCBs).
Copper foil on a printed circuit board is adhered to an insulator (resin board) after being heated and pressurized while having its surface roughened. As part of the quality assurance process, the adhesion of the roughened copper foil with the insulator is evaluated by analyzing Rz (maximum height) to check its surface roughness with a stylus-type surface roughness tester.
One issue with the higher frequencies used by 5G is transmission loss, which is signal lost when an electromagnetic wave passes through the communication path. There are two types of transmission loss—dielectric loss, which is caused by an electrical field generated in a raw material, and conductor loss, which is caused by a conductor’s resistance to a component (such as a wire on a PCB) (Figure 1). For example, in a PCB installed in a 5G antenna, the electrical signal’s higher frequency causes it to be transmitted close to the copper foil’s surface, leading to a type of conductor loss known as the skin effect.
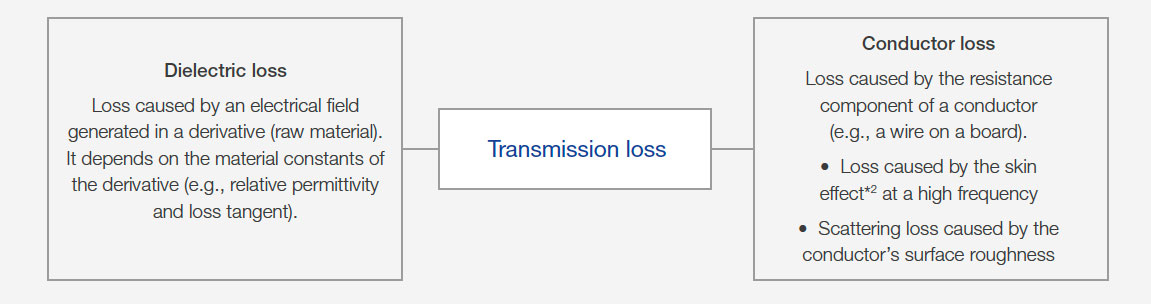
Figure 1: The two types of transmission loss.
The skin effect occurs when transmitting an alternating current in a conductor. As the electrical current’s frequency increases, most of the current flows close to the conductor’s surface, resulting in transmission loss (Figure 2).
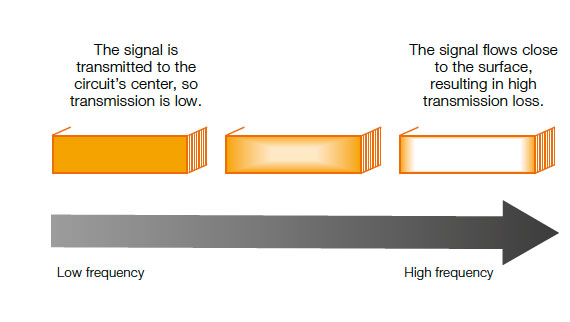
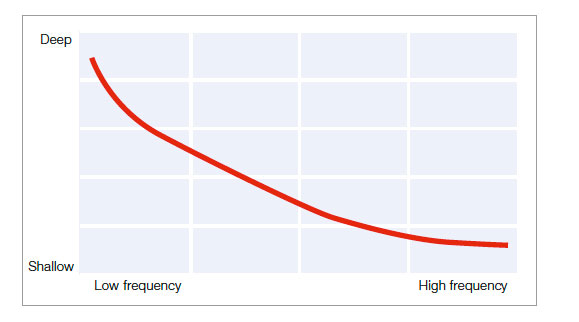
Figure 2: A cross-sectional image of the signal transmission area in a copper circuit (left) and the relationship between frequency and skin depth (right).
However, transmission loss can be reduced by managing the roughness of the copper foil used in the circuits. While rough copper foil can increase transmission loss by scattering the signal, using circuits with concavities and convexities (roughness) smaller than the skin depth leads to a short signal transmission route, resulting in less signal loss (Figure 3).
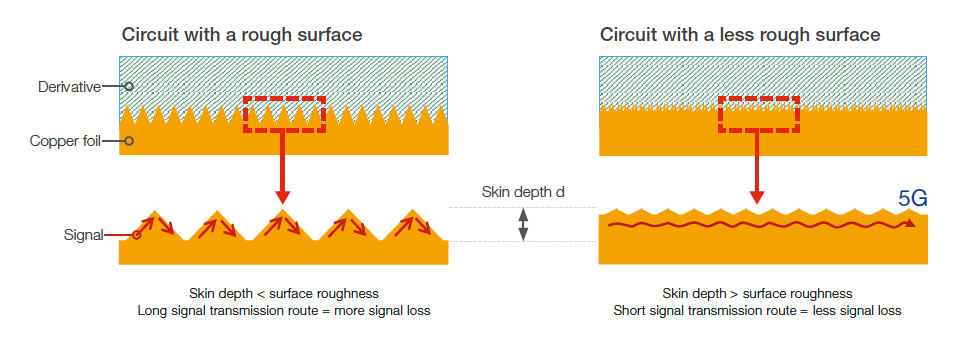
Figure 3: The relationship between a copper circuit’s surface roughness and transmission loss
In 5G applications where high-frequency bands are used, it is extremely important to control the roughness of copper foil. However, evaluating the foil’s roughness using a contact stylus is difficult because the concavities/convexities are smaller than the probe tip’s diameter, making it difficult to capture accurate measurements. In addition, the stylus probe tip can also damage the foil’s surface. In 5G applications, even minute Rz (height) differences can impact the foil’s effectiveness, so using a non-contact, high-resolution laser microscope that enables three-dimensional (planar) evaluation is beneficial.
Solution using the LEXT™ 3D Measuring Laser Microscope
High accuracy measurement of micron-sized roughness
Olympus’ LEXT microscope uses a 405 nm laser with a diameter of 0.4 μm for surface measurement. The microscope’s laser is much smaller than the tip of a contact stylus, making it a more accurate and effective tool for measuring the surface roughness of copper foil. And because the laser does not touch the surface, it can analyze the foil’s roughness without damaging it.
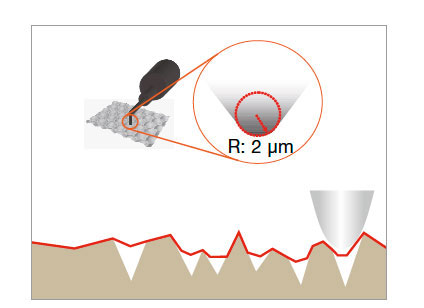
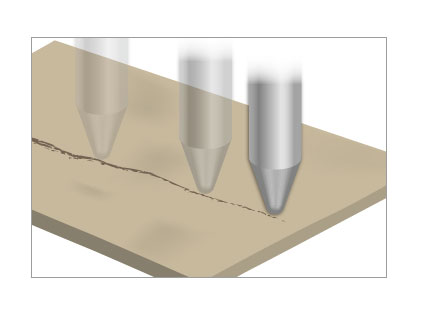
Stylus-type surface roughness tester
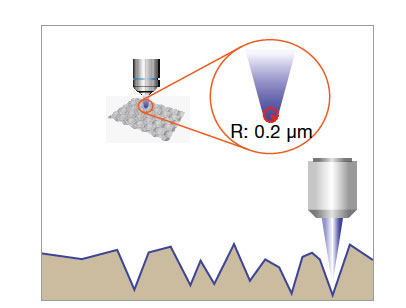
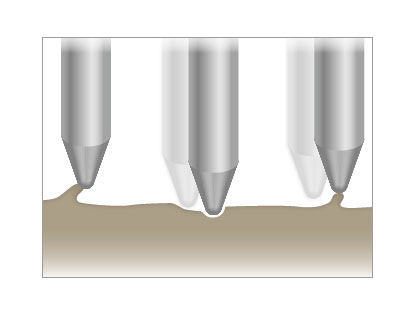
LEXT laser microscope
Acquiring 3D shape data using the LEXT microscope
While stylus roughness testers can only collect information by tracing a single line along the measurement plane, the LEXT microscope collect roughness data over an area using its laser. This enables you to capture much more data compared to oneline information alone.
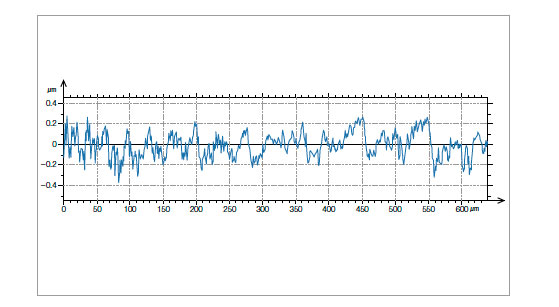
One-line cross-sectional data obtained by a stylus roughness tester
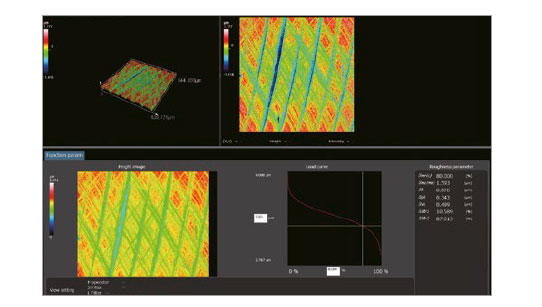
Surface roughness information provided by laser scanning
Using a LEXT microscope, we measured the line roughness and surface roughness of a copper foil’s surface. The roughness data obtained by the laser microscope contains much more information than what we obtained using a stylus.
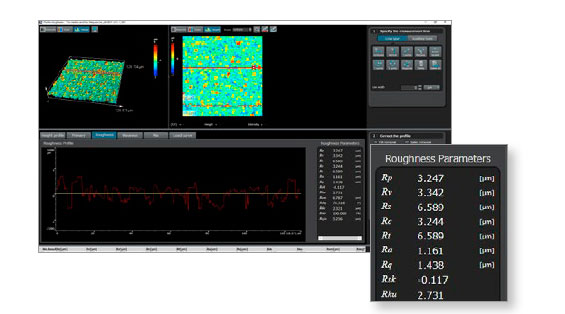
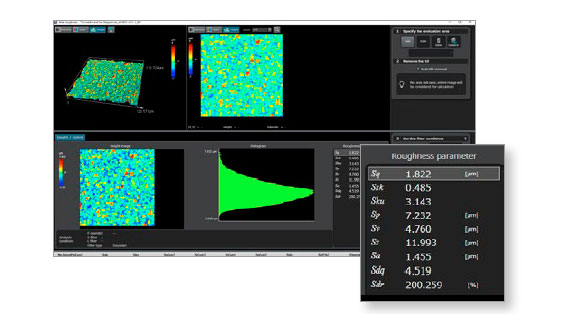
Figure 4: Surface roughness provides much more information than one-line measurements using a stylus.
The advantages of the LEXT microscope’s comprehensive analysis function
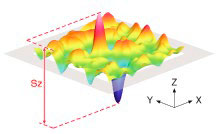
Sz is a parameter that indicates the gap between the maximum peak height and the maximum valley depth in the measurement range. However, it is significantly influenced by scratches, foreign materials, and local deviations in the shape of unevenness in the measurement range due to its use of peak values. The same is true for the Rz (height) of line roughness measured by stylus roughness testers. Therefore, we recommend that you evaluate the data’s average value in several areas of the copper foil plane.
When analyzing the data acquired from several areas, it is important to perform image processing as necessary and to use the same measurement conditions for all data. The LEXT microscope can easily apply the same measurement conditions to several areas using its comprehensive analysis function. The measurement results can be output to Excel, while the images—including 3D—make it easier to compare specimen measurement values.

Image processing conditions and measurement conditions are applied to all data in a single operation.

Measurement data can be transferred to an Excel spreadsheet.
Choose the right objective lens with the Smart Lens Adviser
Using the wrong objective can lead to poor-quality data when using a laser microscope. However, the LEXT microscope’s Smart Lens Adviser helps you to determine which lens is most suitable for your roughness measurement. Just enter some basic information, and the adviser will rate the suitability of the objective that you selected, so you can be confident you are using the right lens for the application and capturing high-quality data.
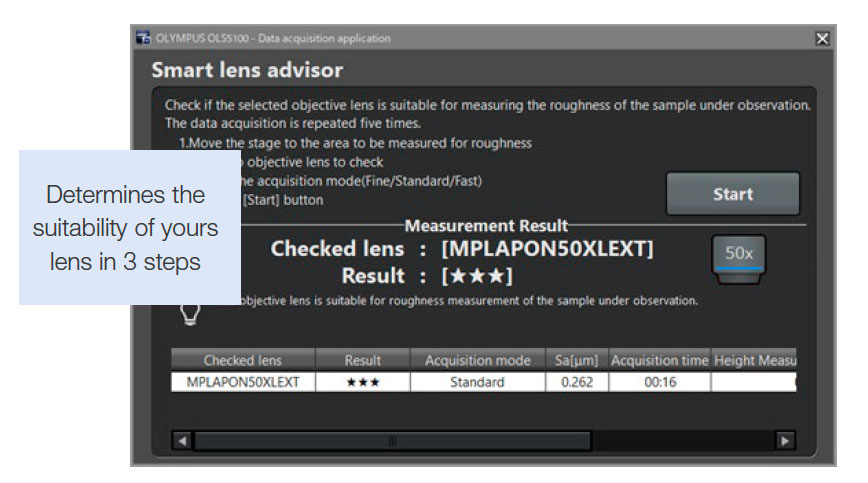
*Does not guarantee the measurement value
Simplify your workflow with the Smart Experiment Manager
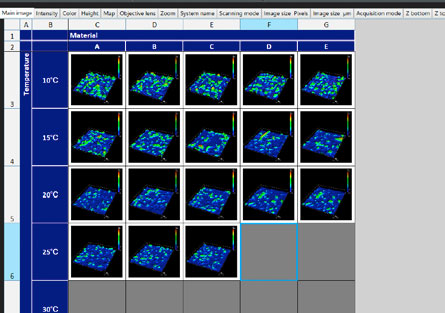
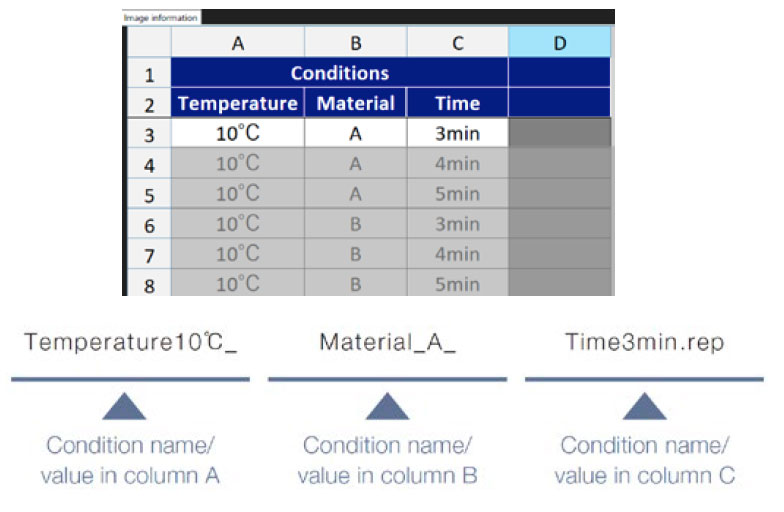
To manage copper foils’ roughness, several conditions must be verified, including the concentration, temperature, and electrolysis time of each plating solution composition used for roughening the foil’s surface. The optimal conditions are determined by combining various conditions. To verify that the roughness meets acceptable parameters, the Smart Experiment Manager eases your workflow with convenient management tools that simplify preparing the experiment plan, data acquisition and analysis, and data reporting, helping reduce the risk of human error and preventing rework.
Smart Experiment Manager Benefits
Reduce data acquisition errors
If you discover that you have missed some data when your analysis is complete, it can be slow and expensive to run the experiment again. The LEXT microscope enables you to obtain data and check the results in line with your experiment plan to reduce data acquisition errors and prevent rework
Automatic file name creation
Image file names containing the relevant experiment conditions are automatically generated based on the measurement conditions input when preparing the experiment plan.
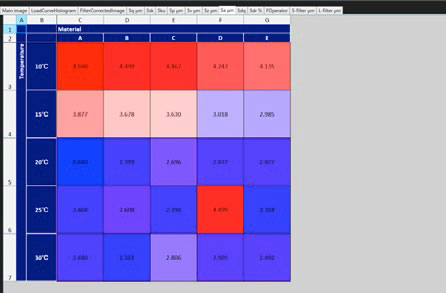
Visualize abnormal results in real time
A heat map makes it easy for you to confirm trends in measurement values while you are obtaining data. With the map, you can immediately visualize trends, so you can detect abnormal values early in your experiment.
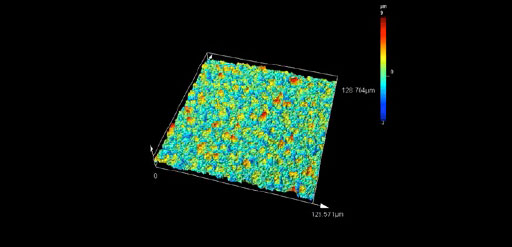
Copper foil roughness measurement parameters
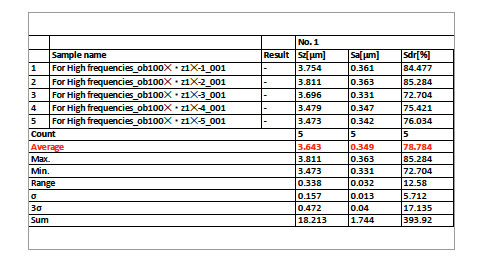
Below, we examined the roughness measurement results for five areas on a piece of copper foil (Table 1).
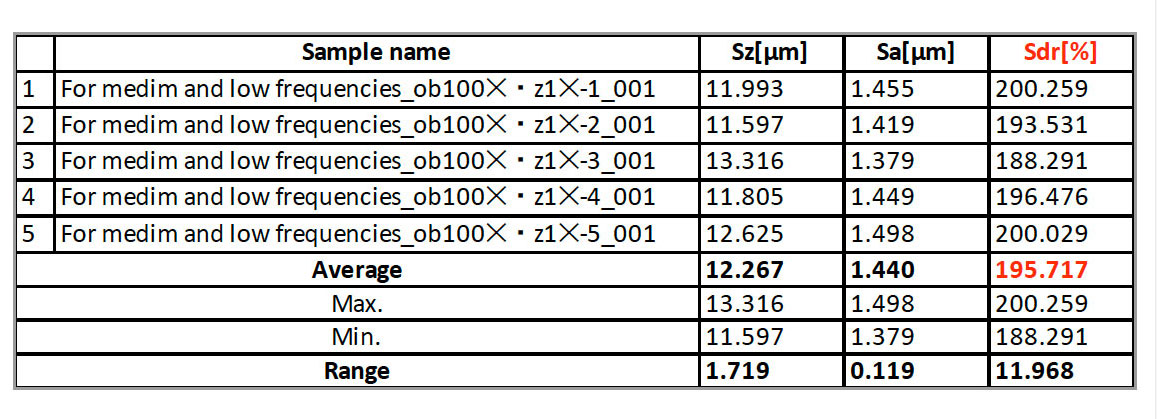
First, when checking the difference (range) of Sz (maximum height) measurement values, there was a 1.7 μm gap between the maximum and minimum values in the data for five areas. Since Sz is a parameter that indicates the gap between the maximum peak height and the maximum valley depth in the measurement range, this demonstrates that the gap between the maximum and minimum values in the areas measured is represented by the values.
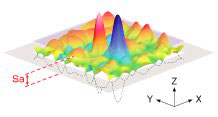
Additional suggested roughness parameter—arithmetical mean height (Sa)
Sa indicates the average height difference for the average plane in the measurement area. It provides stable results since the parameter is not significantly influenced by scratches on the plane, foreign materials, or other disturbances. As a result, the gap between the measurement values for the five areas is only about 0.1 μm. Compared to Sz, Sa enables stable evaluation with a smaller gap between the maximum and minimum values.
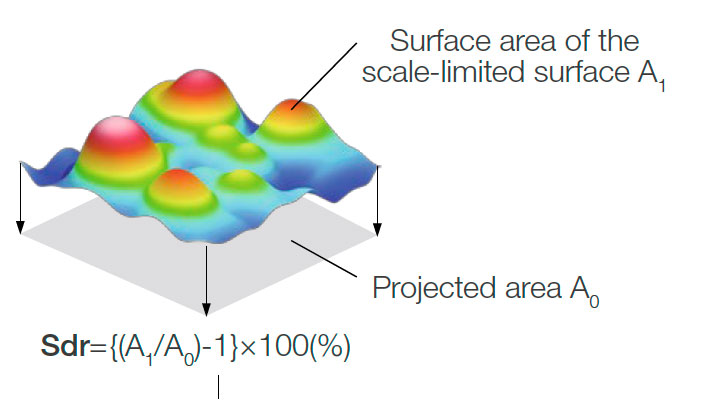
Additional suggested roughness parameter—developed interfacial area ratio (Sdr)
The copper foil surface shape includes not just elements such as gaps in the height of concavities/convexities but also their sizes in the plane direction and the degree of their scattering. Sz and Sa described above are both parameters that focus on the height (depth) of the surface. Sdr (developed interfacial area ratio) is a parameter that signifies the rate of increase in surface area. The increase rate is calculated from surface area A1, which is derived by the area A0 of the surface projected onto the XY plane.
Sdr values increase as the surface texture becomes both finer and rougher.
We compared the surfaces of two copper foils with different roughness conditions. Tables 2 and 3 show the Sdr values and their average for five areas on the foils’ surfaces. The “high frequency” sample has smaller Sdr values than the “middle and low frequency,” which means that the former has less unevenness and a smaller gap between the maximum peak height and the maximum valley depth. Since the signal transmission route becomes shorter as the Sdr value becomes smaller, the “high frequency” copper foil is expected to have less transmission loss.
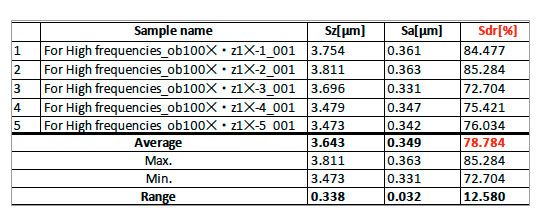
Table 2: Sdr measurement values (%) of copper foil for high frequencies
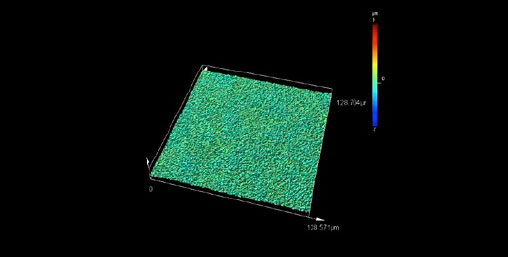
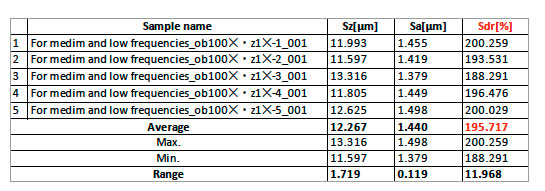
Table 2: Sdr measurement values (%) of copper foil for middle and low frequencies
Conclusion
In this application note, we demonstrated the advantages of using a laser microscope for surface roughness measurements on copper foil over a conventional stylus tester. To summarize, because it uses a laser to capture data, the copper foil is undamaged by the measurement process.
The amount and quality of the data captured by a LEXT™ laser microscope is also far more robust than what a stylus can capture. The LEXT microscope can acquire three-dimensional data from an entire plane so that Sz for surface roughness can be evaluated in addition to Rz (maximum height). Sa (or arithmetic mean height) can also be evaluated. This parameter has the additional benefit that it is not significantly influenced by scratches, foreign materials, or other disturbances. Lastly, the developed interfacial ratio (Sdr)—a surface roughness parameter that shows the rate of increase in surface area—can also be evaluated.
The benefits above clearly illustrate why laser microscopes are the preferred roughness measurement tool for copper foil used in 5G and other high-frequency applications.