1. Introduction
In the field of ultrasonic nondestructive testing (NDT), the total focusing method (TFM) is now a widely known and accepted nondestructive testing (NDT) imaging technique. Moreover, the method is now commercially available on several portable devices, including OmniScan™ X3 series flaw detectors, and TFM is growing in popularity within the NDT community.
However, although TFM enables easier image interpretation than conventional phased array (PA) inspection, the use of a single element in transmission during acquisition can result in images with a low signal-to-noise ratio (SNR). This low SNR is due to poor acoustic penetration, typically in thick parts or in highly attenuative material.
To overcome this issue, a different implementation of the conventional TFM algorithm using only the phase-related information of the acquired signals is proposed here. It is based on the vector coherence factor (VCF)1, which is used as an image itself removing the amplitude information from the acquired signals. This method, also generally known as phase coherence imaging (PCI), presents certain advantages,2,3,4 including the following:
- Only the instantaneous phase of the signal is considered2, and material attenuation does not affect the phase of the signal, so PCI could be particularly helpful in resolving the challenges of thick or highly attenuative material inspection applications.
- Since the amplitude of the signal is not considered, the need for amplitude calibration is eliminated.3
- Improved sensitivity to diffracting geometries and consistency of defect representation among the different scan views.
- Provides a reliable non-amplitude-based method for crack-like defect sizing.3
The remainder of this document explains the basic principles of Evident’s PCI technology, a portion of which is patent pending; notably, its method of producing binarized representations of acoustic echo signals. For this explanation, the operation of the delay and sum (DAS) algorithm, which makes it possible to construct a conventional TFM image with an envelope from the FMC, is first reviewed. Then, it will be demonstrated that the PCI algorithm constitutes a variant of the DAS algorithm.
Examples from real use cases using artificial defects of known nature and geometry permit the comparison of the two types of images, conventional TFM and PCI5, obtained using the two types of algorithms.
2. Review of the Principles of Conventional TFM and the DAS Algorithm
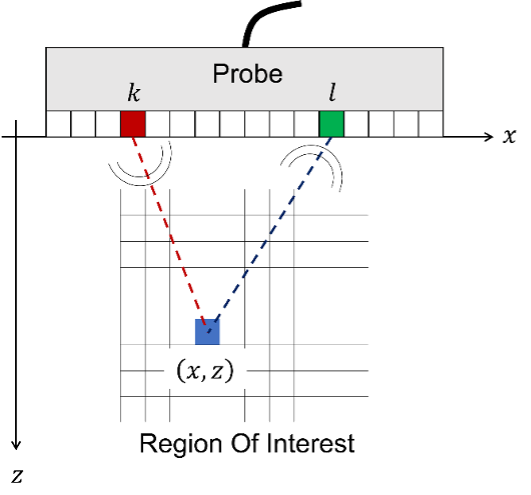
Figure 1. Geometric configuration of FMC acquisition with a probe in contact with the test surface. The piezoelectric element k emits an ultrasonic acoustic wave into the material. The piezoelectric element l receives the reflected ultrasonic sound wave.
Figure 1 shows the geometric configuration of full matrix capture (FMC) acquisition from a phased array ultrasonic testing probe (PAUT) as well as the region of interest (ROI) corresponding to the portion of the specimen to be inspected and viewed using TFM. The piezoelectric element k emits an ultrasonic sound wave. This acoustic wave then propagates in the material of the specimen to be inspected and is reflected by any defects present in the material as well as by the various interfaces. The piezoelectric element l receives the reflected ultrasonic acoustic wave, which leads to the formation of the A-scan signal. skl . The FMC then groups all the A-scans for all the possible kl combinations.
Figure 2 provides a flowchart illustrating in 6 main steps the principle of the delay and sum (DAS) algorithm’s reconstruction of a conventional TFM image from an FMC acquisition:
- The FMC acquisition is performed, which generates the data consisting of all the A-scans sklI (t). The exponent I indicates here that these A-scans are the in-phase signals.
- The Hilbert transform is applied, making it possible to obtain the quadrature components sklQ (t) of the in-phase A-scans sklI (t) acquired and grouped in the FMC data.
- The xklI and xklQ data are extracted using the precalculated delays τkl (x,z). These delays were precalculated according to the type of mode selected (L-L, T-T, TT-T, TT-TT, for example) and the ROI to be observed.
- The summation then obtains two TFM images in quadrature, ITFMI (x,z) and ITFMQ (x,z).
- The amplitude (also called module or envelope) ITFM (x,z) is estimated using the Euclidean distance calculation.
- A post-processing step, enabled by the graphics card, then formats (essentially digital filtering, resampling, and resizing) the TFM image, which is presented to the user on the display of the instrument.
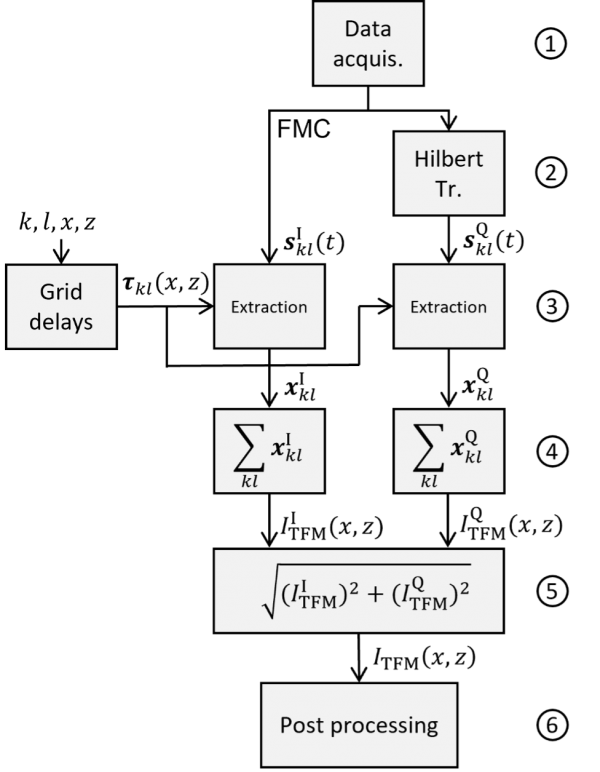
Figure 2. Principle of the 6-step DAS algorithm for obtaining an amplitude TFM image from an FMC acquisition.
3. Principles of the PCI Algorithm
A principal differentiator of the PCI algorithm implemented in the OmniScan X3 64 flaw detector from conventional TFM and other phase-based signal processing technologies is that it contains an innovative acoustic signal binarization component (patent pending). If we compare the PCI algorithm to the steps in the DAS algorithm shown in Figure 2, it differs in two main respects:
- An additional step, step 3b (Figure 4), which consists of quantifying the signals sklI (t) and sklQ (t) using the function sign. This step makes it possible to highlight the coherence of the signals as explained later in this article.
- Calculating the amplitude using the norm L∞, also called the Chebyshev norm, instead of the Euclidean norm used in conventional TFM.
3.1. Concept of Phase Coherence
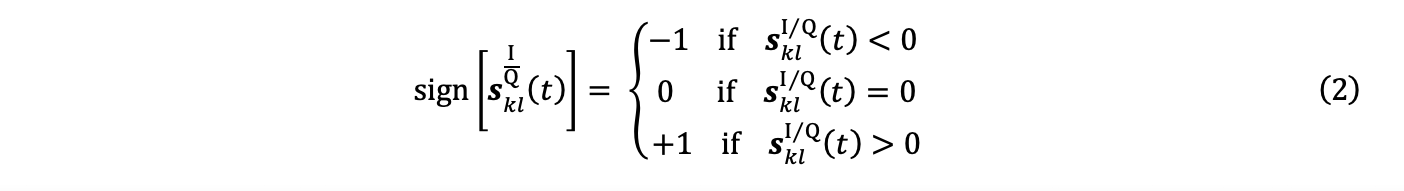
Enabling a good understanding of the nature of PCI necessitates the introduction of the notion of signal coherence, a fundamental principle of this method. This paragraph introduces the concept in a simplified form. For this, attention must be paid to the operation of the function sign, sometimes called the signum function.
The function sign quantifies a signal s(t) on 3 distinct levels, +1, 0, and -1:
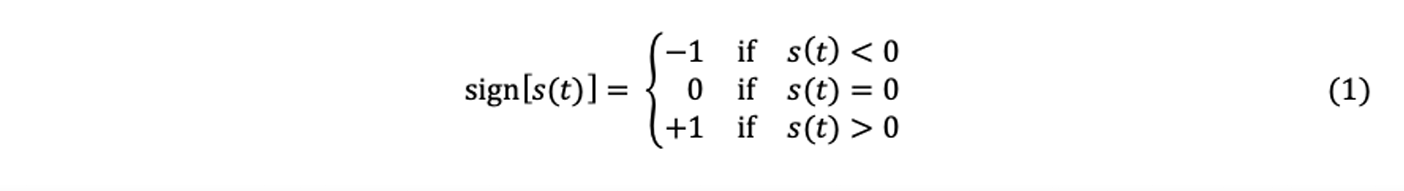
To better understand the effect of this quantification operation on the signals, figure 3 shows, by way of an example, the result of the application of the function sign on an A-scan s(t), chosen here arbitrarily for demonstration purposes. By observing Figure 3, it is possible to note the following:
- The signal has two zone types: (1) so-called coherent zones indicating the presence of indications, which are symptomatic of the presence of defects, and (2) so-called noncoherent zones indicating the absence of indications and the presence of pure noise. It should be noted that this noise originates mainly in the intrinsic electronic noise of the instrumentation, but it is also structural noise linked to the interaction of the acoustic waves with the material of the specimen.
- In the coherent zones the intensity of the signal remains constant and contained between 1 and −1 in the quantized signal (Figure 3(b)), while the amplitude decreases with time in the case of the raw signal (Figure 3(a)) (owing to geometric attenuation, for example).
- In the quantized signal of Figure 3(b), there is strong noise present, with a chaotic aspect, at a much higher level than the almost imperceptible noise level in the raw signal of Figure 3(a). This helps explain, and as the examples proposed in this document will show, why TFM images obtained by PCI have a “noisier” appearance than conventional TFM images, which you can see by comparing Figure 6(a) and 6(b) or Figure 8(a) and Figure 8(b). However, these areas with high levels of chaotic noise (noncoherent areas) have a statistical distribution independent of the position in the image, unlike the coherent areas. Because of this difference, and despite a noisier appearance, in an image generated by PCI, it is easier to distinguish the coherent areas from the noncoherent ones. The adapted colormap applied by default in the OmniScan X3 64 device when using PCI helps to facilitate this distinction by the user as shown in Figure 6(c) and Figure 8(c).
The behavior of the function sign is therefore used in PCI,5 on the one hand, to maintain consistent signal intensity—regardless of the depth of investigation, for example—and on the other hand, to separate the coherent zones, likely corresponding to the presence of defects, and the noncoherent chaotic zones corresponding to an absence of flaws. It should be noted that the coherence of the signals is information carried by the phase of the signal.
From a certain perspective, the information communicated by PCI can be considered as quasi-binary in nature, in that “coherence/noncoherence” equals “presence of a defect/absence of defect.” The problem then consists of adopting a strategy that separates these two regimes. The way or ways that this can be accomplished is not addressed in this document, but an adapted color map, such as the one implemented in OmniScan X3 64 flaw detector, assists the task of separation.
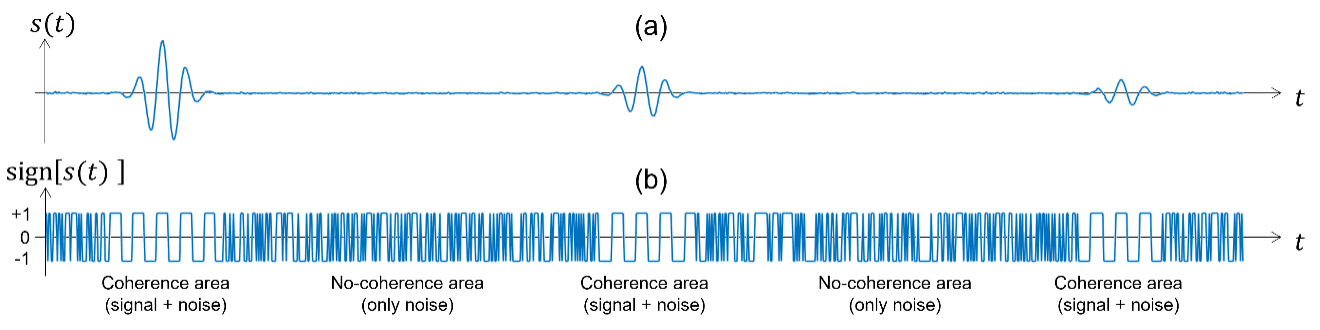
Figure 3. Raw A-scan type signal and noise (a) and quantized signal using the function sign (b).
3.2. PCI Algorithm
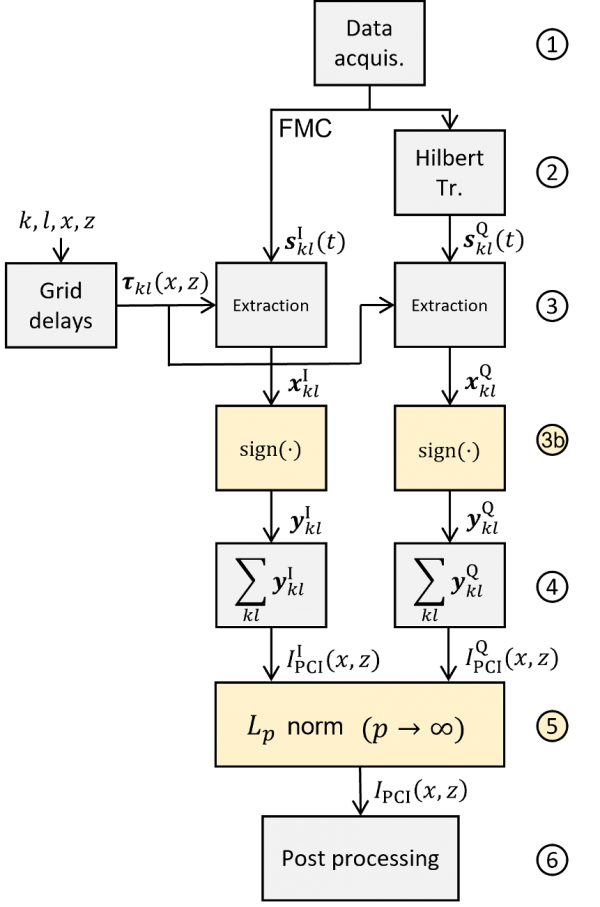
Figure 4. Principle of the PCI algorithm.
The flowchart in Figure 4 summarizes the PCI algorithm implemented in OmniScan™ X3 64 flaw detector as follows:
- Acquisition phase that constructs the FMC data consisting of all the A-scans sklI (t). The exponent I indicates that these A-scans are in-phase signals.
- Application of the Hilbert transform, which makes it possible to obtain the components in quadrature sklQ (t) of the in-phase A-scans sklI (t) acquired and grouped in the FMC data.
- Extraction of the data xklI and xklQ using the delays τkl (x,z). These delays have been calculated beforehand according to the type of mode selected (L-L, T-T, TT-T, TT-TT, for example) and the ROI to be observed.
These first three steps are identical to those of the DAS algorithm in Figure 2.
3b. Quantization of the signals xklI and xklQ using the sign function according to equation 1, which leads to signals yklI and yklQ:
Step 3b is an additional step specific to the PCI algorithm.
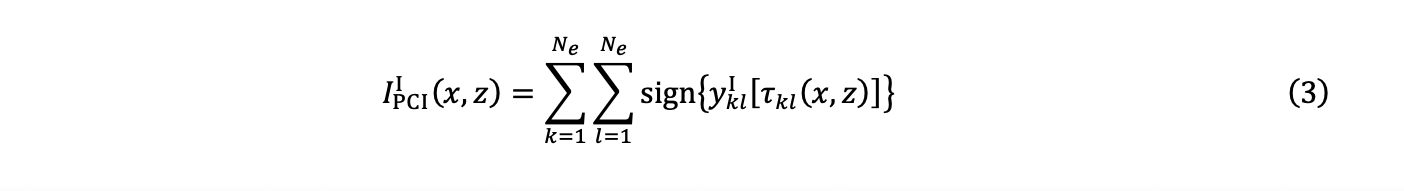
4. The summation obtains two PCI images in quadrature, IPCII (x,z) and IPCIQ (x,z):

5. Finally, the amplitude IPCI (x,z) is estimated using the calculation of the Chebyshev distance, also called the uniform norm, or norm L∞, and the two components of equations (3) and (4):

with p→∞.
Estimating the amplitude from equation 5 is difficult to achieve with p→∞. A good approximation can then be obtained using the following expression:
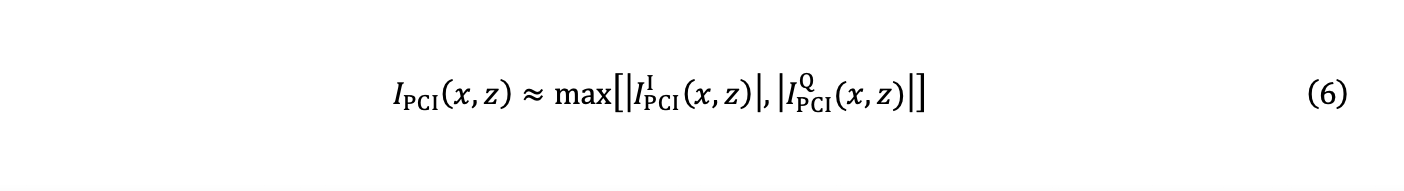
That is, by retaining as the final value the maximum of the absolute values (|⋅|) of the in-phase and quadrature images.
6. Finally, there is a post-processing step, identical to that of the DAS algorithm used to obtain a conventional TFM image, enabled by the graphics card, that formats (essentially, digital filtering, resampling, and resizing) the TFM image that is presented to the user on the instrument screen.
It is worth noting that the PCI processing workflow as shown in Figure 4 and implemented in the OmniScan X3 64 flaw detector is completed during the inspection in real time at relatively the same speed (i.e., from data acquisition to image generation) as the device’s conventional TFM.
4. Experimental Examples
Two examples, excerpts from experimental measurements on defects of a known nature and geometry, are presented here to compare images obtained using the two algorithms previously described and to highlight certain characteristics of PCI. These include amplitude robustness and defect tip sensitivity.
4.1. Example 1: Side-Drilled Hole (SDH) Block
The first test example aims to highlight the attenuation robustness property of the PCI method. A block of steel containing 17 SDHs (ASTM E2491 low-carbon steel test block) is inspected without a wedge (i.e., the probe is in direct contact with the part to be inspected) using a 5L64-A32 PAUT probe. This testing configuration is shown in Figure 5.
Figure 6 shows the resulting reconstructed conventional TFM (a) and PCI (b,c) images using the L-L propagation mode. In Figure 6, we can clearly observe the following:
- All the SDHs are displayed with the same intensity in the PCI image, whereas the effect of attenuation can be perceived in the conventional TFM image on the lower SDHs, and the effect of the beam transmitted amplitude on the upper SDHs.
- The background noise level is also higher in the case of the PCI image.
As PCI is an amplitude-free imaging method, the coherent summation of signals happens independently of the amplitude of the signals, and thus produces indications with a high contrast level.3
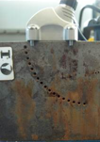
Figure 5. Example 1 test configuration: ASTM E2491 low-carbon steel test block and 5L64-A32 probe.
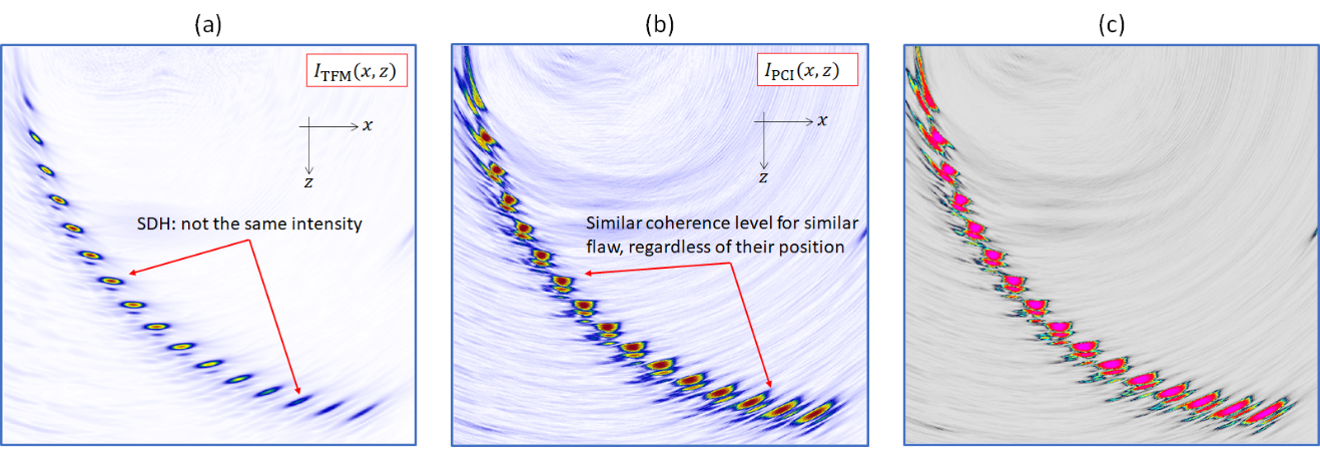
Figure 6. SDH imaging using conventional TFM (a), PCI (b), and PCI with the default colormap implemented in the OmniScan X3 64 flaw detector.
4.2. Example 2: Notch Defect in a Steel Block
Another interesting property of PCI is its sensitivity to defect tips, which enables accurate sizing of discontinuities. It appears that the specular reflections coming from large scatterers are reduced with respect to amplitude summation, as only a few common phase terms contribute to the summation. Thus, PCI tends to be more robust for narrow and pointed reflectors.
To highlight this characteristic of PCI, this second example will present the inspection results on a steel block that contains a non-surface-breaking notch oriented at 70°, using a SPWZ1-N55S-IHC wedge and a 7.5L60-PWZ1 phased array probe. Figure 7 shows the test configuration.
Figure 8 shows the resulting reconstructed conventional TFM (a) and PCI (b and c) images using the TT-TT propagation mode. The following comparisons can be made:
- Specular reflections from large scatterers are reduced with respect to amplitude summation as only a few common phase terms contribute to the summation.
- Contrast is improved for PCI relative to the conventional TFM.
- PCI offers better sensitivity to defect tips.
- The signal-to-noise ratio is lower for PCI.
Thus, even if in this case a conventional TFM image enables a more accurate evaluation of the extent of the notch, PCI enables accurate sizing of notch-like defects, owing to its high sensitivity to defect tips, without using semi-empirical considerations that could be easily misled by a calibration process or attenuation in the material.
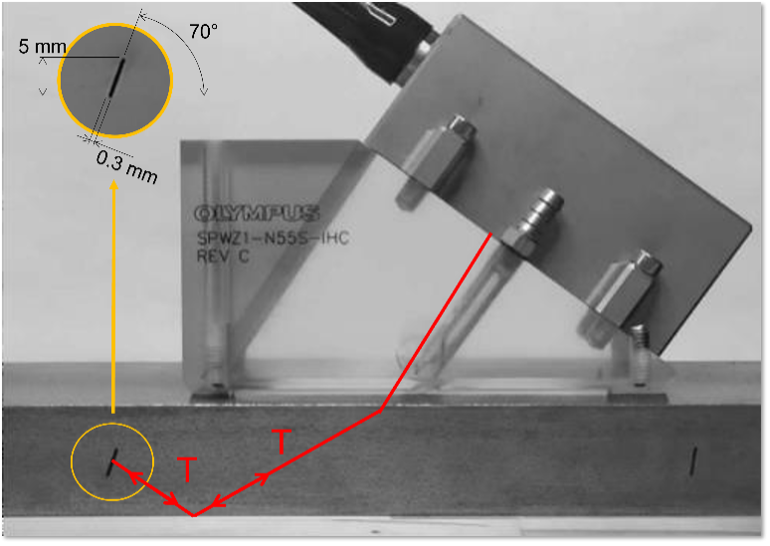
Figure 7. Example 2 test configuration: a low-carbon steel block with an angled notch fabricated using electrical discharge machining, an SPWZ1-N55S-IHC wedge, and 7.5L60-PWZ1 probe.
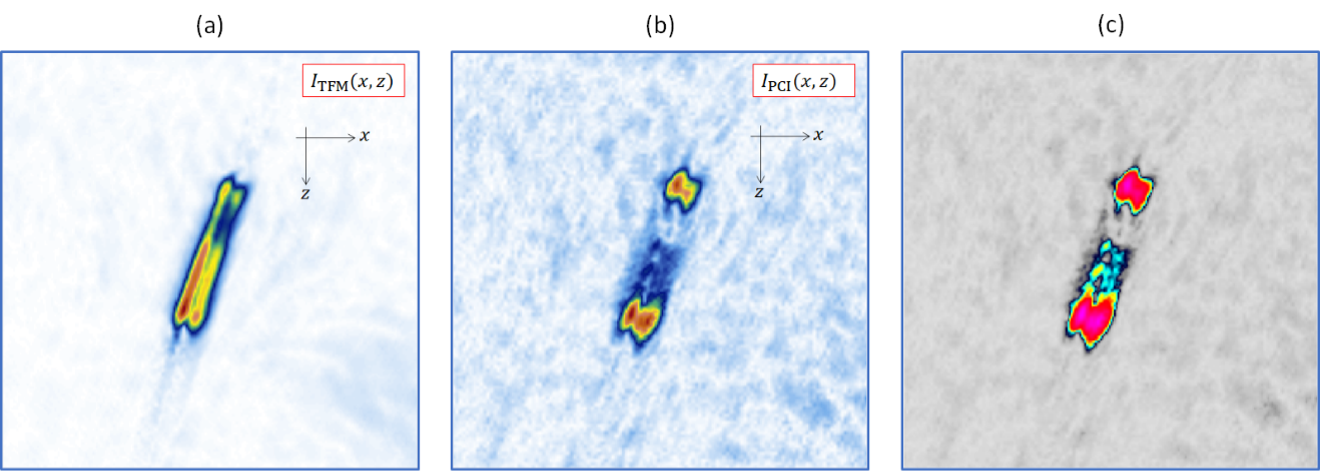
Figure 8. Notch imaging using conventional TFM (a), PCI (b), and PCI with the default colormap of the OmniScan X3 64 flaw detector.
Experimental Findings
In conclusion, our experiments have shown that PCI offers many benefits:
- Since it is a non-amplitude-based imaging method, image interpretation is not based on amplitude-calibrated signals, which is an advantage over amplitude-based conventional TFM.
- Higher sensitivity to narrow and pointed reflectors and more generally to diffractive geometries.
- Enables accurate sizing of notch-like defects without using semi-empirical considerations that could be easily corrupted by a calibration process or attenuation in the material.
- It does not require a calibration procedure, making notch sizing easier and more accurate compared with conventional TFM.
- Gain can be set to a very low value, preventing signal saturation.
- Additionally, an instrument with a powerful enough processor, such as the OmniScan X3 64 flaw detector, generates live PCI images, so the results are displayed immediately during inspection.
However, some drawbacks of this method should also be mentioned:
- It poorly reproduces planar reflectors.
- PCI’s signal-to-noise ratio (SNR) is lower than amplitude-based methods. But, as explained earlier, this is not a major drawback as PCI makes it easy to distinguish coherent areas, indicating the presence of defects, from incoherent areas corresponding to noisy areas of the image.
- Users are accustomed to seeing amplitude-based end views, so there may be an adjustment period.
References
- JF Cruza, J. Camacho, and C. Fritsch, Plane-wave phase-coherence imaging for NDE, NDT & E International, vol. 87, p. 31–37, Apr. 2017.
- B. Gauthier, G. Painchaud-April, A. Le Duff, and P. Belanger, “Lightweight and Amplitude-Free Ultrasonic Imaging Using Single-Bit Digitization and Instantaneous Phase Coherence,” IEEE Trans. Ultrason., Ferroelect., Freq. Contr., vol. 69, no. 5, pp. 1763–1774, May 2022, doi: 10.1109/TUFFC.2022.3163621.
- B. Gauthier, G. Painchaud-April, A. Le Duff, and P. Bélanger, “Towards an Alternative to Time of Flight Diffraction Using Instantaneous Phase Coherence Imaging for Characterization of Crack-Like Defects,” Sensors, vol. 21, no. 3, p. 730, Jan. 2021, doi: 10.3390/s21030730.
- A. Le Duff, N. Badeau, E. Peloquin, G. Painchaud-April, C.-H. Kwan, B. Gauthier, “Total Focusing Method with Phase-Only Ultrasound Signal for Small Flaw Detection,” International Ultrasonic Testing Conference (UT-Online), 2021.
- G. Painchaud-April, A. Le Duff, C. Kwan. C. Brillon, Phase-Based Approach for Ultrasonic Inspection, World Intellectual Property Organization (WIPO). 02.09.2021. WO/2021/168565 https://patentscope.wipo.int/search/fr/detail.jsf?docId=WO2021168565=EP383773045