Advanced Phased Array Inspection for Early Detection of HTHA
Abstract
High-temperature hydrogen attack (HTHA) is one of the most critical failures that assets in the oil and gas or chemical industries may experience, and can lead to environmental contamination, explosions, injury, or even loss of life. For this reason, industries are constantly looking for better methods to detect HTHA at its early stage, when corrective action can still be initiated.
This study reveals how the latest dedicated phased array (PA) scanners and probes from Evident now enable early detection of HTHA defects—when it is still possible to prevent critical damage to the assets. We describe the strategy used to inspect a weld sample suspected of being affected by HTHA internal damage and present the results of the analysis. We also cover important points, including inspection configuration and data analysis, giving a thorough overview of the process of HTHA detection.
An Introduction to HTHA
High-temperature hydrogen attack (HTHA) is a damage mechanism that affects aging assets, including vessels, hydrocrackers, and heat exchangers in the petrochemical industry. It occurs when hydrogen molecules contained in a liquid or gas hydrocarbon penetrate steel components and combine with carbon atoms inside the steel lattice to form methane. The HTHA process has two important consequences that affect material properties. First, by reducing the carbon content of the steel, HTHA reduces the metal’s hardness; second, build-up of gas pockets at grain boundaries or at other interfaces inside the material can affect the structural integrity of the steel. When combined, these processes can substantially increase the risk of asset failure, with potentially catastrophic consequences.
The risk of HTHA affecting a steel component depends on factors such as age, composition, length of exposure to hydrogen, temperature, and partial pressure. From a structural point of view, methane build-up within the metal causes small (micro) cracks that are impossible to detect nondestructively, but over time these cracks may form clusters or connected cracking that may be “visible” with some nondestructive testing (NDT) methods.
One powerful technique for detecting these small cracks is phased array ultrasonic testing (PAUT). While other techniques such as eddy current enable only subsurface inspection, PAUT can provide detailed maps of indications in components up to 100 mm in thickness, using detectors placed on only one side of the material. PAUT uses an array of elements to detect ultrasound signals deflected from interfaces such as cracks, voids, and impurities, meaning that with the correct equipment configuration, PAUT can detect HTHA microcracks with a high sensitivity and resolution.
Current Standards in HTHA Detection
There are a number of key regulations outlined by the American Petroleum Institute (API) designed to standardize the process of HTHA detection. For example, API Recommended Practice 941 [1] describes the use of one or a combination of technologies for the detection of HTHA, including TOFD (time-of-flight diffraction), PAUT, and TFM (total focusing method). The API code sets staging guidelines for HTHA damage as follows (Figure 1):
- Incubation stage—undetectable by NDT
- Optical stage—damage can be detected optically (micrograph)
- Stage of rapid mechanical property deterioration
- Cracking stage
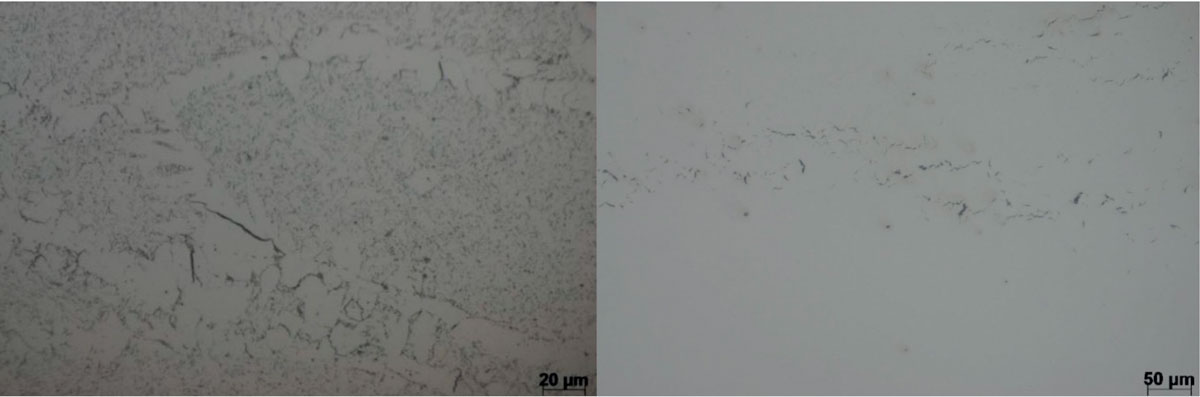
Figure 1.
HTHA in the optical stage (left) and connected fissures form cracks (right)
To prevent damage to affected materials, HTHA must be detected as early as possible. However, early stage HTHA is usually characterized by fissures or microcracks that can be difficult to differentiate from material imperfections such as inclusions or even grain boundaries. Although cracks present in advanced-stage HTHA can be detected with ultrasound testing, it is often too late to deal with the problem effectively at this stage, as there is already an increased likelihood of equipment failure.
The Latest Developments in HTHA Detection Solutions
Adding to its existing range of scanners and TOFD probes for the OmniScan™ X3 flaw detector, Evident recently launched a series of dedicated probes designed for the detection of early stage HTHA. These solutions include highly sensitive linear PAUT probes for low-noise, high-gain TFM inspection, a series of high-frequency TRL (transmitting-receiving-longitudinal) angle-beam probes (Figure 2), wedges for inspection under the weld cap, and Dual Linear Array™ (DLA) probes for completing inspection of the heat-affected zone (HAZ) or body of a vessel (Figure 3).
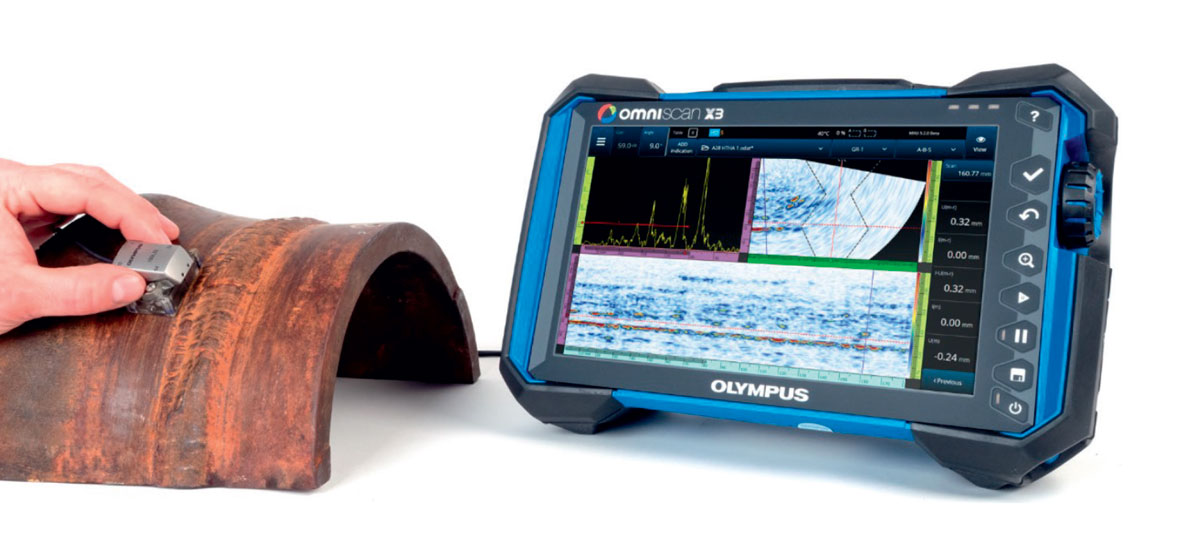
Figure 2.
A28 angle-beam T/R probe for weld inspection and the OmniScan X3 flaw detector
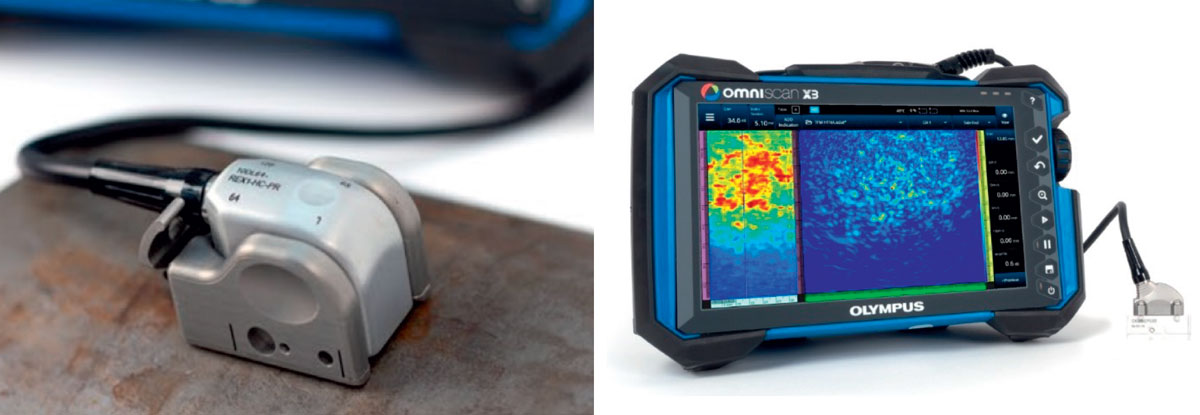
Figure 3.
10 MHz DLA probe for 0-degree inspection of the HAZ and body (left) and A31 high-sensitivity linear probe for TFM (right)
Detecting HTHA within a component requires high sensitivity and high penetration power, making dual probes a natural choice for accurate inspection. Typical dual probes (based on two single elements or arrays) have the capability for geometric focusing, in which two acoustic elements define the bases of a triangle, whose tip is the point of geometrical focus.
The angle at which the two elements are oriented toward the sound propagation path (the so-called ‘roof angle’) gives the depth of geometrical focusing for such a transducer (Figure 4). By combining geometrical focus with the focusing power achieved using high-frequency sound waves (10 MHz), dual array transducers offer both passive and active focusing to concentrate the sound intensity at a given area of interest.
Another advantage of dual probes is the removal of potential noise-generating internal wedge reflections. This is thanks to the design of the receiver, which is completely isolated from the transmitter by an acoustic barrier. This means that only echoes arriving from the inspected part are registered, allowing the wedge to be built shorter, minimizing the sound path through Rexolite and saving energy for propagation through the steel.
Evident’s 10 MHz Dual Linear Array probes (10DL32-A28 and 10DL64-Rex1) are provided with wedges that enable geometrical focusing at depths of 15 mm, 25 mm, and 60 mm, and also provide an electronic focusing capability for up to around 80 mm. This means that 10 MHz DLA probes can be used up to a depth of 95 mm in steel components.
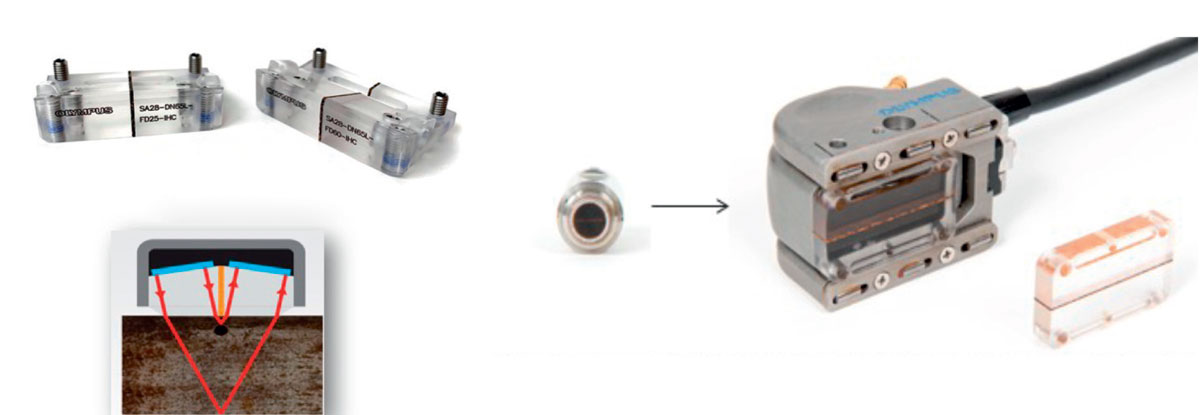
Figure 4.
Concept of a DLA probe (top left) and its geometrical focusing (bottom left) and replaceable focused SA28 wedges (right)
Methods of Sensitivity Calibration and Weld Inspection
As with most amplitude-based measurement and detection techniques, PAUT requires calibration of equipment sensitivity prior to the inspection. This is usually achieved by scanning metal blocks that are manufactured to contain induced cracking or known side-drilled holes (SDHs) with sizes closely matching that found in HTHA.
In this study, 0.2 mm diameter SDHs in a cluster were used for the initial sensitivity calibration. The acquisition gain was increased in steps of 18 dB and the sensitivity was then validated against acquisitions on a block with artificially induced cracking prior to weld sample inspection. The reference blocks and probes used are shown in Figure 5.
After calibration, a sample of material suspected of being affected by HTHA was chosen for inspection. The sample used was a 150 mm × 150 mm block from a larger weld belonging to a heat exchanger (Figure 6).
The inspection strategy involved several steps:
- Screening the weld volume with high-frequency TOFD (time-of-flight diffraction)
- Scanning with a dual PA angle-beam probe:
- The weld volume was scanned with sectorial scans from 40 to 70 degrees with probes positioned on each side, at 15 mm and 30 mm, from the weld centerline (4 scans).
- The HAZ was scanned with sectorial scans from −15 to 15 degrees on each side, at 15 and 30 mm, from the weld centerline (4 scans).
- The entire suspected area excluding the weld was then scanned using a 0-degree dual-linear probe
- TFM was subsequently used to scan the weld volume for confirmation
- Finally, WeldSight™ software was used to merge the data and perform an automated analysis
In the first phase, the weld sample was screened with an AxSEAM ™ scanner (Figure 6) mounted with 15 MHz TOFD probes, followed by scanning with a dual PA angle beam to cover the weld and a linear 0-degree beam to cover the HAZ. As well as providing capabilities for both circumferential and longitudinal scanning, the AxSEAM scanner also enabled parameters such as acquisition speed and coupling efficiency to be continuously monitored through the on-board ScanDeck™ module.
In the second phase, a DLA probe (Figure 3 left and Figure 4 top left) was used to complete scanning of the HAZ and the zones adjacent to the weld with 0-degree beams. After the TFM acquisition was performed using dedicated linear probes, the data were subsequently merged in WeldSight software, which provides detailed automated analysis for rapid flaw detection.
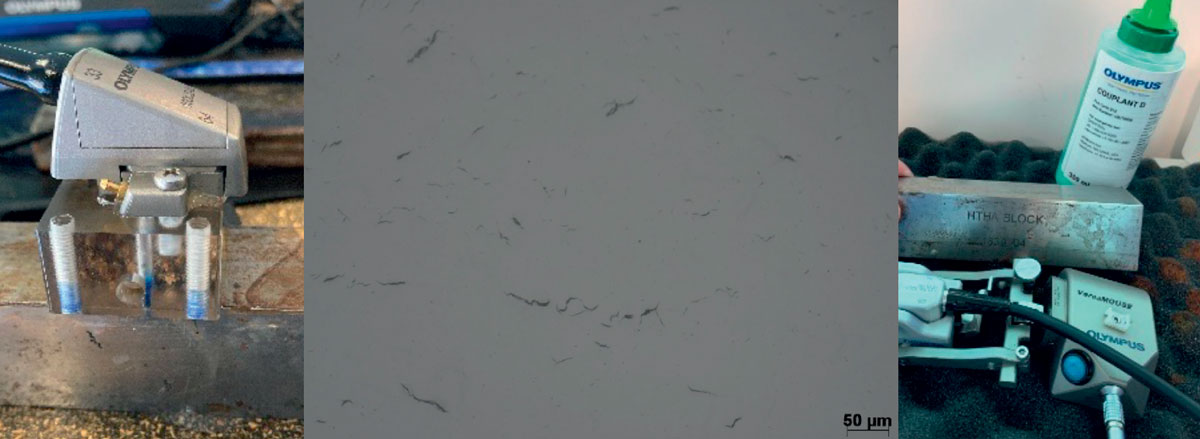
Figure 5.
SDH reference block (left) and induced HTHA block for validation (center and right)
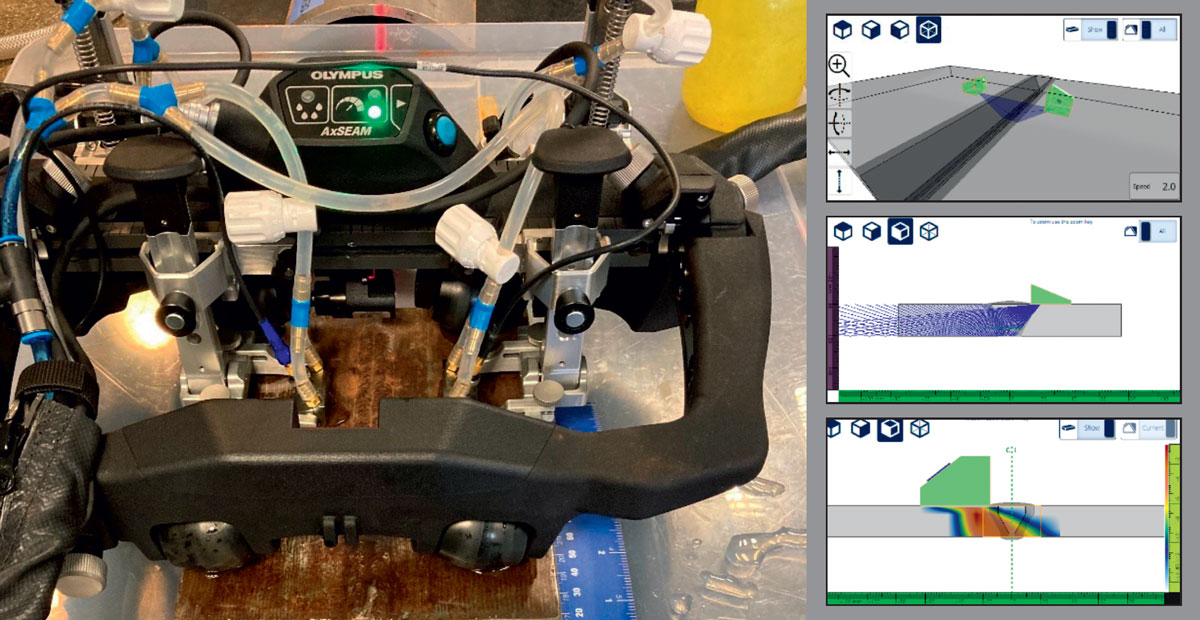
Figure 6.
AxSEAM scanner used for TOFD, PAUT, and TFM scanning and the respective scan plans (top to bottom on right)
Weld Inspection Results
TOFD Scanning Results
The results from the TOFD screening revealed several connected indications extending from 65 mm (from the inspection datum) up to the end of the inspection area. The same array of indications was revealed by the 51-degree B-scan acquired with the right skew angle. The indications seem to be positioned underneath the weld centerline, at a depth of around 14 mm. TOFD and PA data confirming the same indication is shown in Figure 7, and an overview of the scan is shown on the right-hand side of the figure.
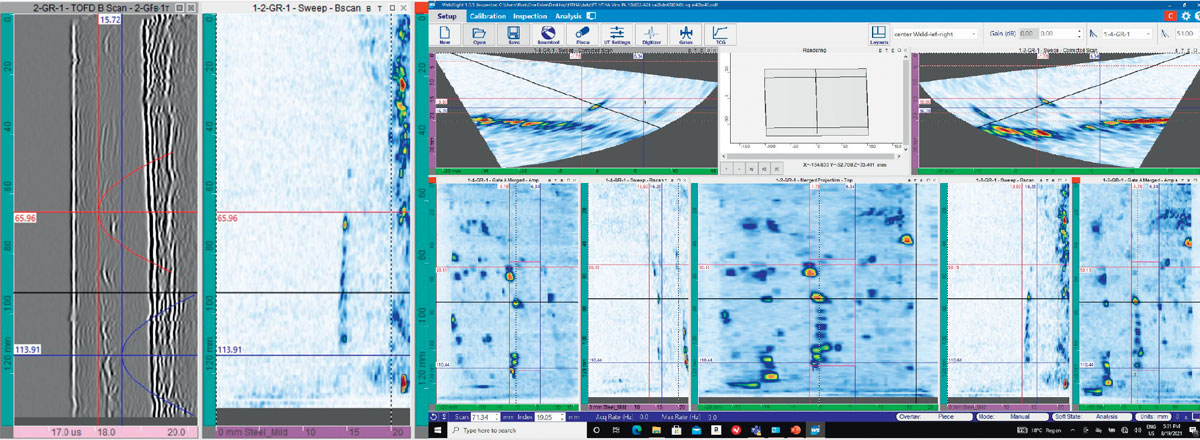
Figure 7.
Side-by-side comparison of TOFD and dual PA B-scan at 51 degrees (left) and the connected cracks were confirmed by dual phased array (right)
The data acquired in step 2 of the inspection strategy were first imported into WeldSight software and merged. The result is a top, side, and an end view of the part, displaying several of the detected indications (Figure 8). The volumetric top view (top-right view in Figure 8) shows a particular concentration of flaws in the weld volume in the second half of the scan, as well as in the right-hand side of the scan. Looking at the side and end views, the flaws predominantly cover the last 5 mm range of the thickness above the back wall. In addition, the side view shows more indications, which are visible from 40 mm toward the scan end, confirming the TOFD data. A series of indications previously detected with TOFD are also visible between 70 mm and 120 mm on the scan axis.
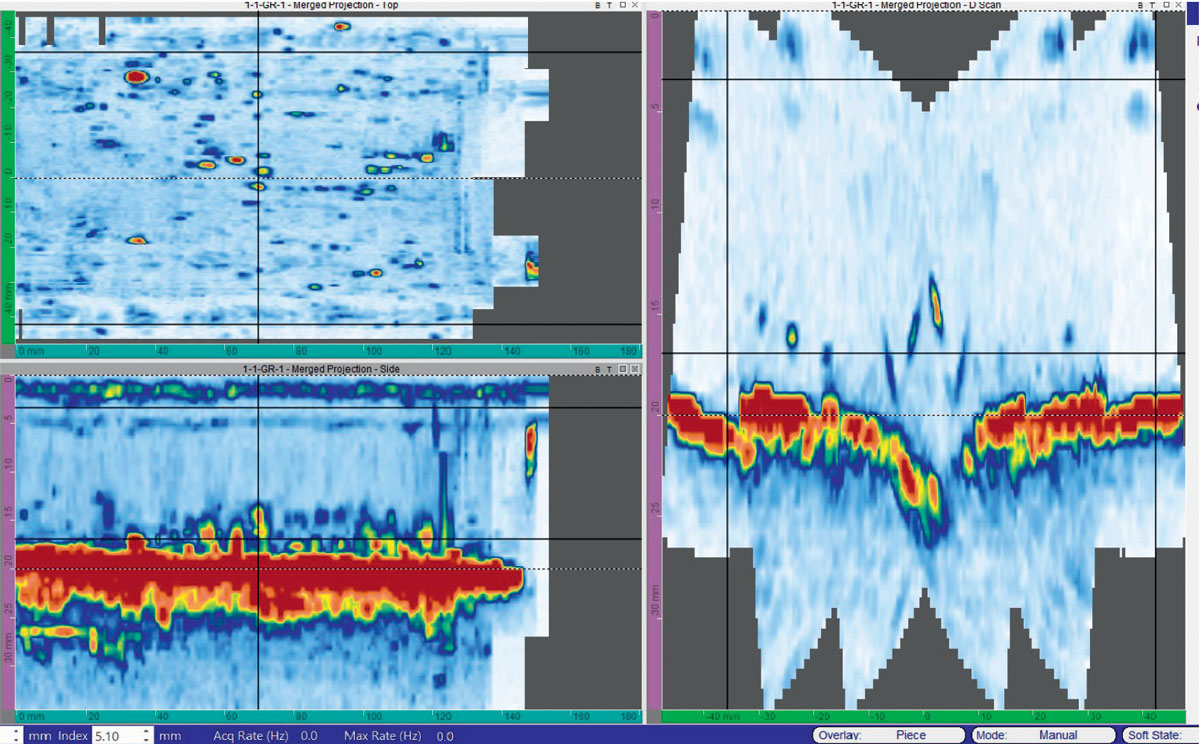
Figure 8.
10DL64-A28 DLA probe—sectorial (40 to 70 deg.) scan, skew −30, −15, +15, and +30; sectorial (−15 to +15 deg) scan, skew −30, −15, +15, and +30 mm. All angle beam data merged: top view (top left), end view (right), and side view (bottom left). Flaws are concentrated in the weld area and the right-hand side of the HAZ.
Dual Linear Array Probe Results
The inspection performed in step 3 of the strategy used the 10 MHz DLA probe depicted in Figure 3 and wedges with a roof angle that enable a focus point at 15 mm (geometric focusing). Together with the electronic focusing set at 15 mm, a high-intensity ultrasonic beam was directed perpendicular to the back wall and used to scan the entire suspected area, with the exception of the weld cap and volume. The irregularity of the weld cap prevents efficient coupling between the PA probe and the sample. The data generated after scanning with the DLA probe was subsequently merged and analyzed in WeldSight software. As shown in Figure 9, a large number of indications are visible at depths ranging from 11 mm to the back wall of the sample. The software’s cluster analysis tool detected 100 indications over the entire scanned area.
TFM Results
The last step involved confirming the presence of tiny indications using the TFM method. For this analysis, scanning was performed using the linear high-frequency probe as shown on the right in Figure 3, with the probe covering both the left and right side of the welded sample. After this analysis, several of the indications previously identified were confirmed by the TFM data. An example is given in Figure 10, where the T-T (transverse-transverse) propagation mode was used. T-T is a pulse-echo wave set where both legs of its path are transverse waves.
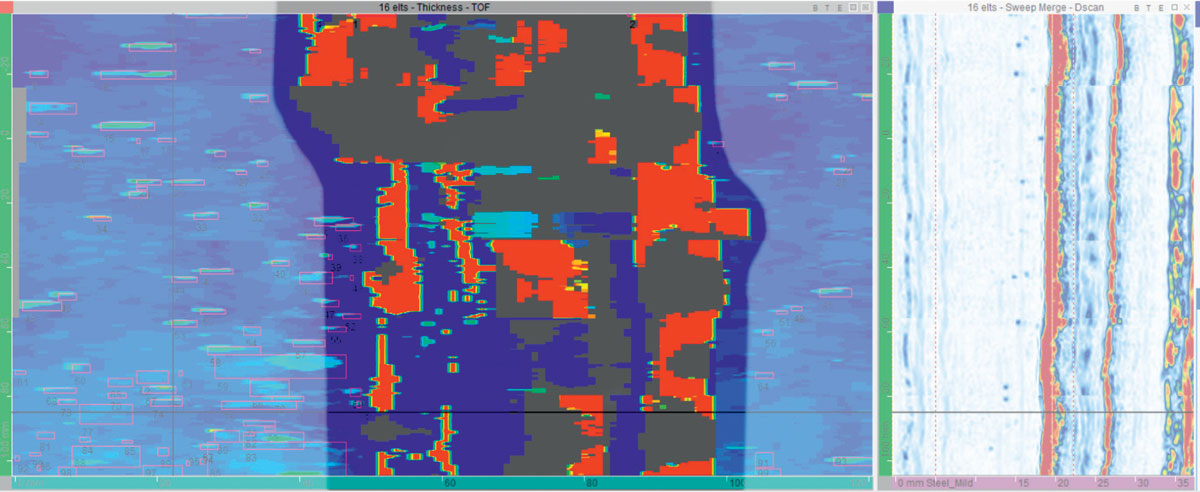
Figure 9.
Inspection with DLA PA probe (10Dl64-Rex1) in the HAZ. Cluster analysis—approx. 100 flaws detected
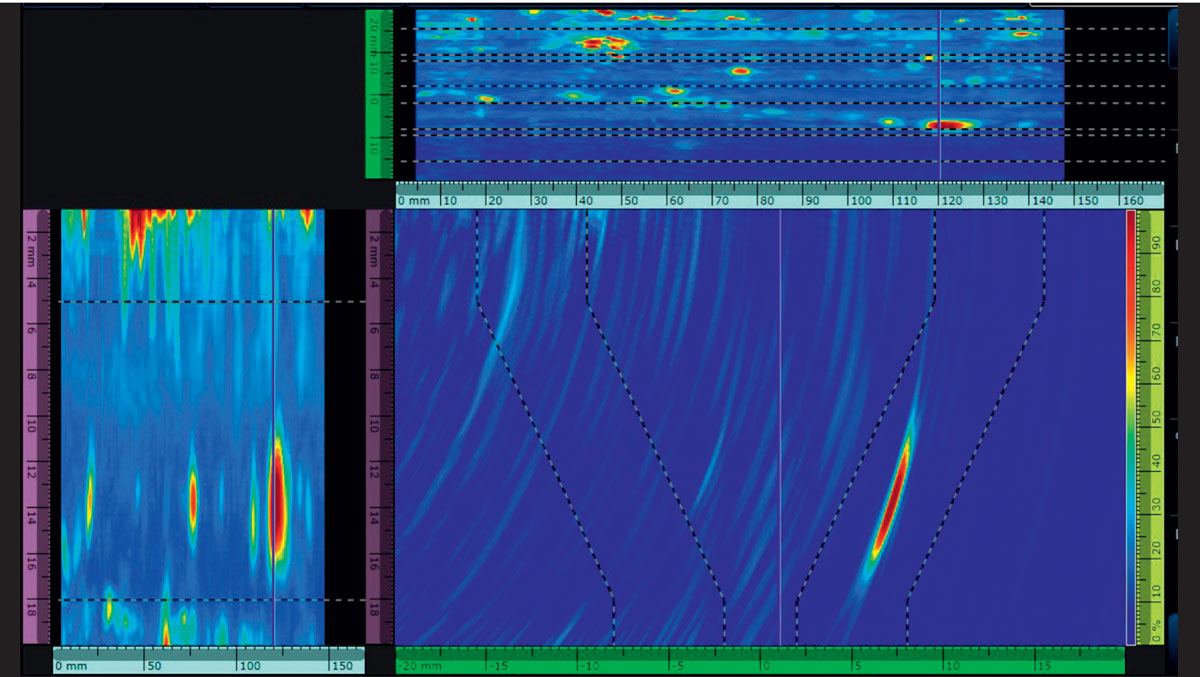
Figure 10.
TFM data acquired on left skew along the sample, looking at the weld volume
Conclusions
The HTHA inspection conducted was based on a reference block with SDHs of 0.2 mm in diameter. With the acquisition amplitude of the SDH set at 80%, HTHA inspection was performed with an acquisition gain increased by 18 dB. The combination of high gain, small wavelength (0.6 mm for 10 MHz L-waves), and steep focusing in the passive aperture (roof angle) with both physical and aperture separation of transmitter and receiver (T/R probes) enabled a very high sensitivity of detection with minimal wedge and material noise. The inspection process permitted the complete inspection of the weld body and its HAZ, as summarized below:
Weld Volume
The weld volume was scanned with angle beams, TFM, and TOFD. Several indications were detected—some with a connected crack pattern—which was confirmed by all three techniques. Other indications looked more like random cracks or inclusions, while some isolated indications presented higher reflectivity.
HAZ and Adjacent Area
More indications were detected at 0 degrees in the HAZ compared with angle-beam sectorial scanning. These were randomly displaced with higher concentration on the left-hand side of the weld.
The results of this study show PAUT to be a powerful method for detecting early stage HTHA—associated inclusions were detected using three different methods (TOFD, geometric focusing, and TFM) with Evident PAUT technology. While the nature of the indications cannot be entirely classified as being HTHA damage or inclusions, it is clear that tiny discontinuities can be detected using Evident phased array probes with separated transmitters and receivers, either in angle-beam or zero-degree scanning.
References
- Steels for Hydrogen Service at Elevated Temperaturesvand Pressures in PetroleumvRefineries and PetrochemicalvPlants. API RecommendedvPractice 941, EIGHTH EDITION, FEBRUARY 2016
- https://www.twi-global.com/technical-knowledge/faqs/whatis-high-temperature-hydrogenattack-htha-hot-hydrogenattack
- www.olympus-ims.com
Authors
Florin Turcu
Sabri Baba