The surfaces of films used in a wide range of fields, such as industrial materials, food packaging, and daily necessities, are treated and processed to add transparency, gloss, water resistance, stain resistance, and various other functions to suit the application.
While surface treatments are sometimes evaluated by visually holding the film up to the light to check surface gloss and visibility through the film, there’s also a need to quantitatively evaluate differences in film surface texture.
When quantifying differences in film surfaces, it’s common practice to evaluate surface roughness as a quantitative measure of the surface texture. Sa, Sdq, and Sdr are typical surface roughness parameters used to evaluate surface properties in the height (Z) direction. However, surface roughness (height) is just one factor in the visual perception of film texture. The texture of fine patterns and patterns extending in the planar (XY) direction also has a significant effect.
While most surface roughness parameters evaluate the height component, Sal (autocorrelation length) and Str (texture aspect ratio) are the only parameters that evaluate the planar component.
Quantifying Textural Differences in Surface-Treated Films—An Experiment
To give you a better understanding of how these planar directional parameters help you measure film surface texture, we performed an experiment comparing three films with different textural appearance.
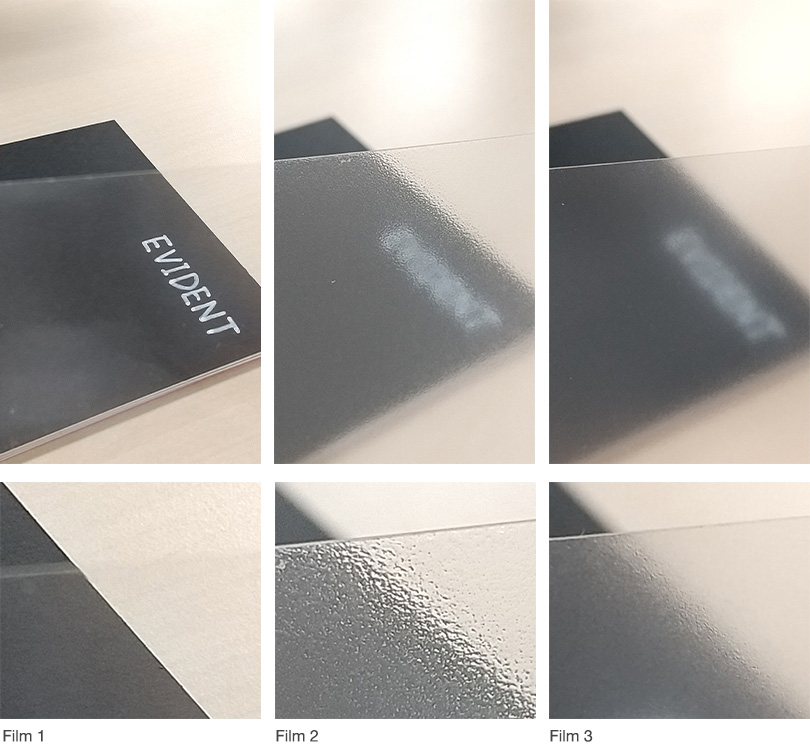
Film 1, where the text through the film appears clear, and films 2 and 3, where the text through the film appears cloudy, have different visual textures. Let's explore what the results would be if we quantify these three films with the planar directional parameters Sal and Str.
An Overview of Sal and Str
Before we dive into the experiment data, let’s review the basics of each parameter.
Sal (autocorrelation length) is a measure of how much an uneven image is similar to (or far from) the original image by shifting it in the horizontal direction (τx, τy). In other words, it indicates the degree of similarity between the image before and after the shift. It is a numerical measure of the density of surface irregularities such as striations and particles in units of length.
The following steps are used to quantify the results:
- The uneven image is shifted by one pixel in the horizontal direction (τx, τy).
- After shifting and multiplying the height values of the overlapping shaded areas in the figure below, a series of further operations such as normalization are performed. These processes are called autocorrelation operations. In this way, an autocorrelation image transformed from the original image is created.
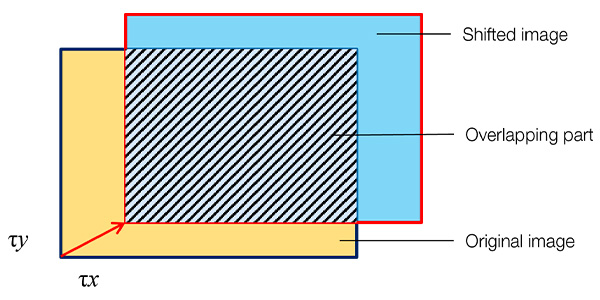
Process of creating an autocorrelation image.
- Mathematically, the autocorrelation function (ACF) is expressed as:
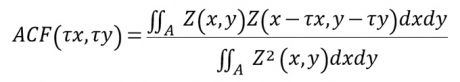
- The closest lateral distance (rmin) that decays to the correlation value s (0 ≤ s < 1, s = 0.2 if not specified) in the autocorrelation image is the Sal value.
Str (texture aspect ratio) is defined as the ratio of the furthest lateral distance (rmax) that decays to the correlation value s (0 ≤ s < 1, s = 0.2 if not specified) in the autocorrelation image and Sal (rmin) in an autocorrelation image.
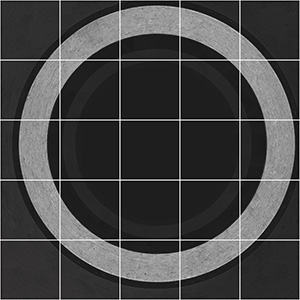
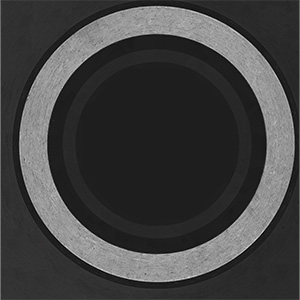
Here are Sal and Str in a three-dimensional (3D) view:
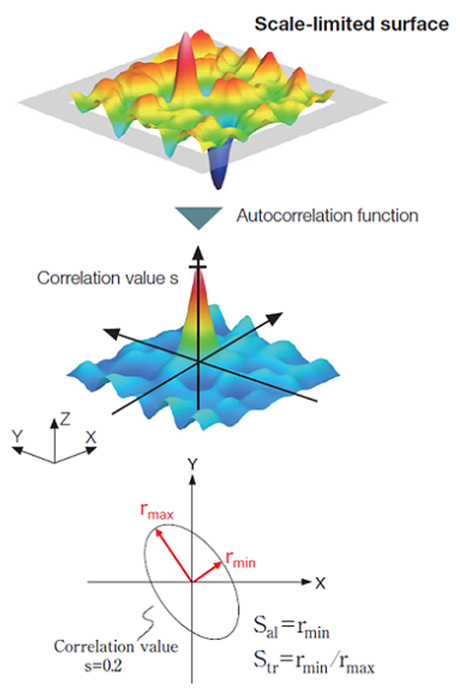
Here are Sal and Str from a two-dimensional (2D) perspective:
![]()
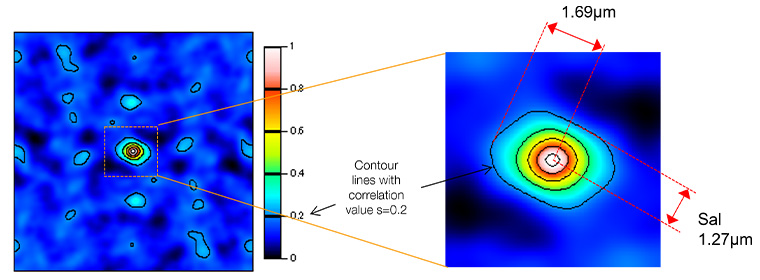
Sal = 1.27 μm. Str = 1.27/1.69 = 0.752.
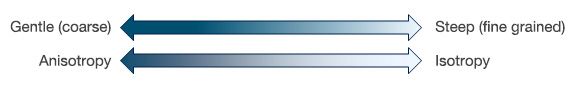
For Sal, the smaller the value, the steeper the surface irregularity, and the larger the value, the more gradual the shape dominates. Str ranges from 0 to 1, with Str > 0.5 usually indicating strong isotropy*, and conversely, Str < 0.3 indicates strong anisotropy**.
* Independence of properties and distribution in any direction. In this case, it refers to the fact that the distribution of the shape is evenly spread and unbiased in all directions.
** The dependence of a property or distribution in a direction. Here, it refers to the fact that the distribution of the shape is spread in a certain direction.
Evaluating the 3 Film Surfaces with 3D Laser Scanning Microscopy
For this experiment, I first visually confirmed the surface conditions of the three films in three dimensions using a LEXT™ OLS5100 3D laser confocal microscope.
To acquire the 3D data, the OLS5100 microscope scans the sample surface with a 405 nm violet laser beam. The dedicated LEXT objectives, which are adapted to the 405 nm wavelength and minimize aberrations, make it possible to clearly capture minute patterns and defects that are difficult to capture with conventional optical microscopes and general laser microscopes. The optical system also takes non-contact measurements, so there’s no need to worry about damaging the surface even with a soft sample such as film.
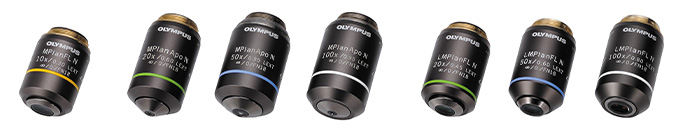
Dedicated LEXT objectives from left to right: 10X low magnification objective, 20X, 50X, and 100X high-performance objectives, and 20X, 50X, and 100X long working distance objectives.
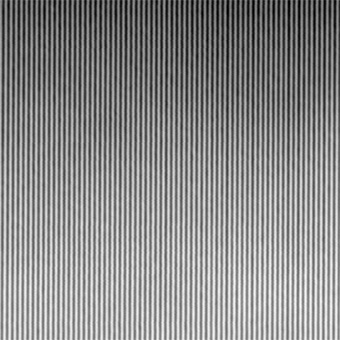
Red laser (658 nm: 0.26 μm line and space). |
Violet laser (405 nm: 0.12 μm line and space). |
In addition, the OLS5100 microscope can perform reliable surface roughness analysis in accordance with ISO 25178, evaluate the parameters Sal and Str (unique to surface roughness), and stitch multiple images into one to acquire highly accurate widefield data. You can even specify areas from the stitched image on the macro-map for easier analysis of the surface texture.
This last feature is demonstrated in the following step, where I created a stitched image to capture the surface roughness data of the film surfaces in a wider area.
Capturing Surface Roughness Data from a Broader Perspective
The limit of size visible to the human eye is about 0.1 to 0.2 mm, and the size of the texture on the film surface that can be visually confirmed is considered to be of equal or greater size.
As the film surface texture may contain even smaller irregularities, it is important to select an objective lens with higher resolution and magnification when acquiring data. Since the observation range of one field of view becomes narrower with high-power lenses in exchange for higher resolution, the OLS5100 microscope's stitching mode is useful for widefield observation.
Individual images acquired with a high-magnification objective lens can be stitched (essentially linked together like a puzzle) to obtain high-resolution, wider-field-of-view images of widely scattered features at intervals of tens to hundreds of millimeters.
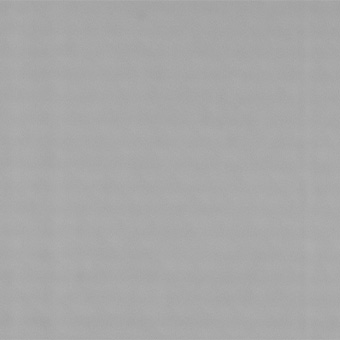
Individual 2D images before stitching. |
2D image after stitching. |
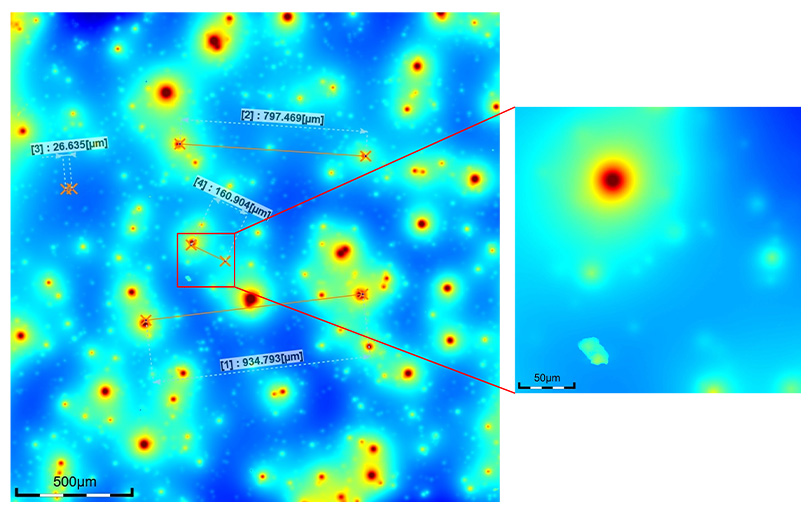
Left: 9 × 9 stitched height images (50X objective, about 2000 µm square). Height images are 2D images that represent height data in a color-coded band. Right: single image, about 250 µm. When viewed in the stitched image, the spread of large and small textures can be seen at intervals of tens to hundreds of µm.
Now let's look at the actual analysis results for the three films.
Below are the 3D images and surface roughness measurement results of the surfaces of each film 1–3 acquired with the OLS5100 microscope over an area of about a 2 mm square.
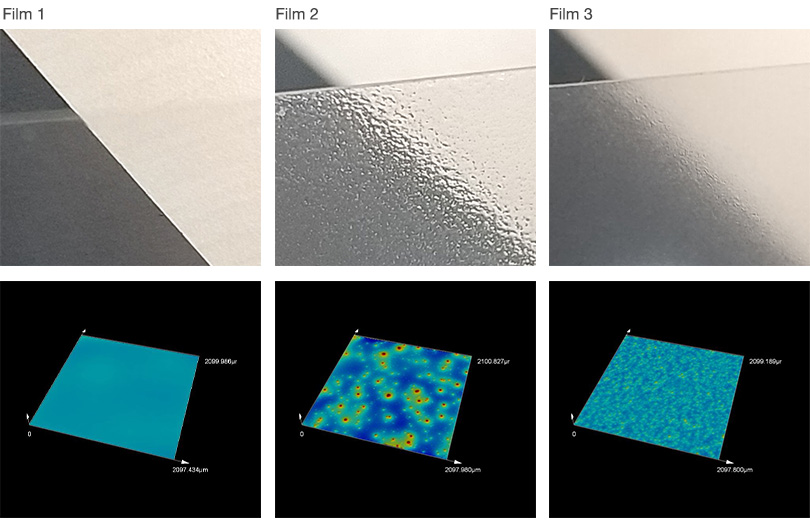
3D image comparison of films 1–3. The bottom row shows 9 × 9 stitched images (50X objective, about 2000 µm square).
| Sample | Sa [µm] |
|---|---|
| Film 1_ob50x_9x9 | 0.069 |
| Film 2_ob50x_9x9 | 1.181 |
| Film 3_ob50x_9x9 | 0.391 |
Surface roughness value in Sa.
As shown in the table above, in terms of Sa (arithmetic mean height), which is commonly evaluated for surface roughness, the differences in the unevenness of the film surface among the three samples is well represented in the values. Regarding the correlation between the visual surface appearance and the distribution of 3D irregularities, we can see that film 1 has a smooth surface. In contrast, films 2 and 3 have localized or full surface irregularities.
Now let’s look at the roughness parameters Sal (autocorrelation length) and Str (texture aspect ratio), which quantify the extent of this unevenness.
| Sample | Sa [µm] | Sal [µm] | Str |
|---|---|---|---|
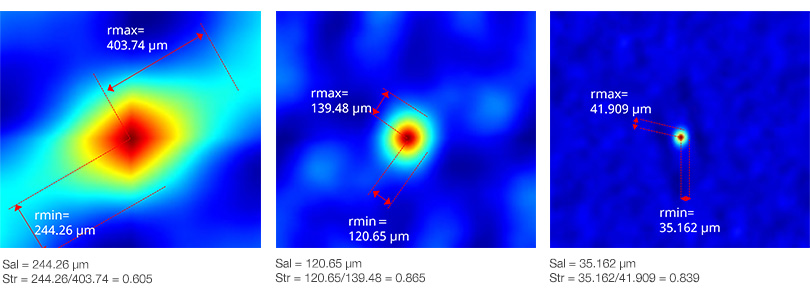
| Film 1_ob50x_9x9 | 0.069 | 244.26 | 0.605 |
| Film 2_ob50x_9x9 | 1.181 | 120.65 | 0.865 |
| Film 3_ob50x_9x9 | 0.391 | 35.162 | 0.839 |
Surface roughness value in Sa, Sal, and Str.
As defined above, the smaller the value of Sal, the steeper the surface irregularity, and the larger the value, the more gradual the shape dominates. The Sal values of the samples are related, as shown the table above. As you can see in conjunction with the 3D images, film 1 with a higher value indicates a more gradual surface profile. In contrast, film 3 with a lower value indicates a steeper surface profile and finer grain.
Str is defined as the ratio of the furthest lateral distance (rmax) that decays to the correlation value s (0 ≤ s < 1, or s = 0.2 if not specified) and Sal (rmin) in an autocorrelation image. It is expressed by the following formula:
Sal = rmin
Str = rmin/rmax
The Str values for the three samples show little difference between films 2 and 3, and some difference between these two films and film 1.
Str ranges from 0 to 1. Given that Str > 0.5 usually indicates strong isotropy and Str < 0.3 indicates strong anisotropy, all three samples have a value of 0.5 or higher. So, we can conclude that the distribution of uneven shapes is isotropic. If anything, film 1, which is closer to 0.3, is slightly more anisotropic than films 2 and 3, which have values well above 0.5.
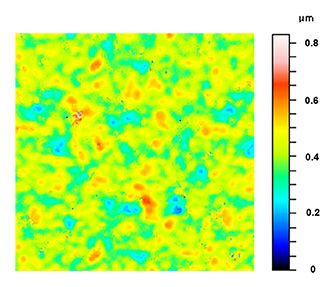
Height Image
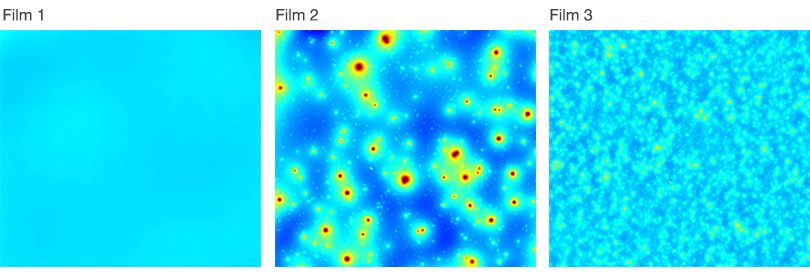
![]()
Autocorrelation Image
![]()
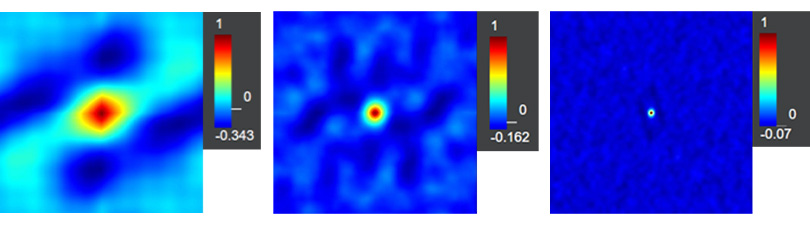
Enlarged View of the Autocorrelation Image
Determining the Textural Differences of the Films with Spatial Parameters
From the data, we can make the following conclusions about the three film surfaces with different textural appearance.
- Based on the Sa (arithmetic mean height) value, the clearer the film appears to be (as in film 1), the less uneven and smoother its surface is.
- From the Sal (autocorrelation length) values, film 1 with higher values has a more gradual surface profile. Film 3 with lower values has a steeper profile and finer grain.
- Based on the Str (texture aspect ratio) values, the directional distribution of the surface irregularities is evenly spread and less biased (isotropic) for all samples. Comparing the three, film 1 is slightly more directional than the other two (slightly anisotropic).
With data you can trust, the OLS5100 microscope is expected to contribute to the evaluation of film surface roughness in a wide range of fields. For more guidance on using the OLS5100 3D laser confocal microscope to measure the surface roughness of film, reach out to our team.
Related Content
Water Repellency and Surface Roughness in Films: Example Using a Yogurt Lid
Brochure: LEXT OLS5100 3D Laser Microscope
Static Electricity and Surface Roughness in Films: An Experiment