Phased Array and Ultrasonic Weld Testing Analysis
Validating indications is eased through the software’s numerous analysis tools, including:
- Volumetric data merge: In large parts, screen the whole weld in one view to efficiently evaluate indications.
- Slice/projection cursors: After merging the data, the software produces Top/Side/End views with projection and slice cursors. Projection cursors offer a full view of the sample while filtering unwanted echoes.
- File merge: The software stitches together independently acquired data files, so all indications appear together in one image.
- Linked dynamic B-scan: Refreshes B-scan views of all PA groups simultaneously so less cross-validation is required. Characterize flaws faster from both sides.
- Max amplitude/Min thickness: Automatically positions the cursor at the key positions, the maximum amplitude (for weld inspection), and the minimum thickness (for corrosion detection).
Fine-Tune Your Weld Inspection Data
Correct acquisition errors in post-analysis.
TOFD synchronization: Realign the TOFD B-scan to improve the readability.
TOFD lateral wave suppression: Improve the detection of flaws that are close to the lateral wave signal.
Offline encoder calibration: Adjust minor position errors by correcting the scan and index offsets.
Optimize Your Analysis with Powerful Software Tools
Whether for weld inspection or corrosion monitoring, these practical tools improve your analysis and reporting process:
Corrosion Analysis
Cluster analysis: Software automatically detects indications and provides sizing data for the cluster.
Min thickness tracking: Automatically positions the cursor at the minimum thickness.
File merge (stitching): Consolidate individual scans in a single corrosion mapping display.
A-scan resynchronization: Correct loss of synchronization during acquisition.
Corrosion manager: Groups relevant data and tools, including thickness C-scan, C-scan stats, current data point measurements, cluster analysis sizing, reporting, etc., on the display.
Weld Analysis
Dynamic C-scan: Displays only what is in the gate so you can click and drag the gate to screen regions of interest.
Max amplitude tracking: Automatically positions the cursor at the maximum amplitude.
Editable gates: Compensate for oversights in the gate settings of acquired data.
Weld gate: This is a geometry-based gate that generates a C-scan using only data from inside the weld.
Soft gain and Auto 80%: Quickly adjust the gain to 80% or back to reference level for detection, characterization, or sizing.
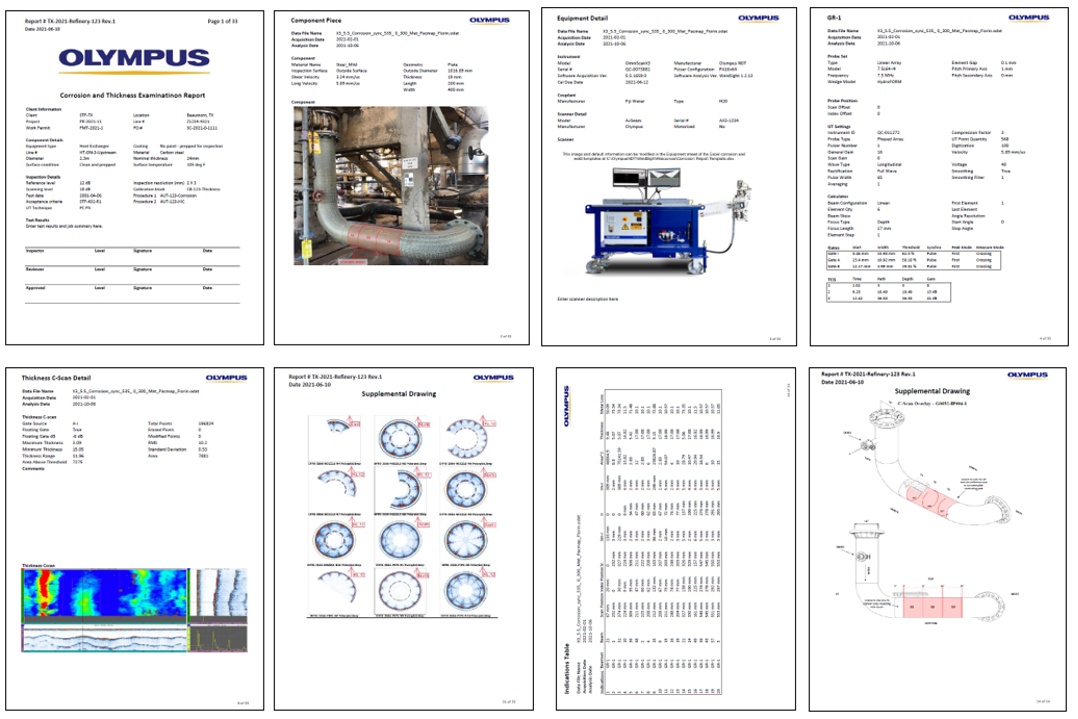
Fully customizable reports: When your weld or corrosion analysis is complete, WeldSight software’s easy-to-use, spreadsheet-based templates enable you to generate professional reports, tailored to your needs.
