8.2 DGS/AVG
DGS/AVG
DGS is a sizing technique that relates the amplitude of the echo from a reflector to that of a flat bottom hold at the same depth or distance. This is known as Equivalent Reflector Size or ERS. DGS is an acronym for Distance/Gain/Size and is also known as AVG from its German name, Abstand Verstarkung Grosse. Traditionally this technique involved manually comparing echo amplitudes with printed curves, however contemporary digital flaw detectors can draw the curves following a calibration routine and automatically calculate the ERS of a gated peak. The generated curves are derived from the calculated beam spreading pattern of a given transducer, based on its frequency and element diameter using a single calibration point. Material attenuation and coupling variation in the calibration block and test specimen can be accounted for. DGS is a primarily mathematical technique originally based on the ratio of a circular probe’s calculated beam profile and measurable material properties to circular disk reflectors. The technique has since been further applied to square element and even dual element probes, although for the latter, curve sets are empirically derived. It is always up to the user to determine how the resultant DGS calculations relate to actual flaws in real test pieces.
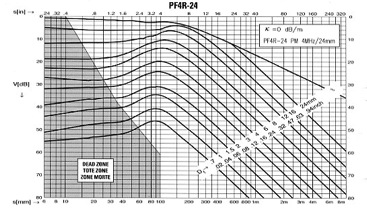 An example of a typical DGS curve set is seen below. The uppermost curve represents the relative amplitude of the echo from a flat plate reflector in decibels, plotted at various distances from the transducer, and the curves below represent the relative amplitude of echoes from progressively smaller disk reflectors over the same distance scale.
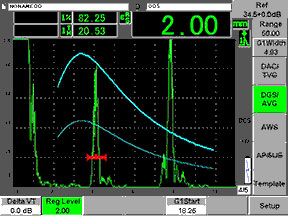
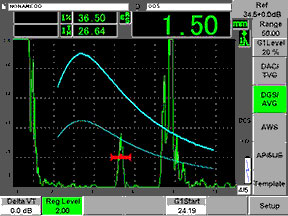
As implemented in contemporary digital flaw detectors, DGS curves are typically plotted based on a reference calibration off a known target such as a backwall reflector or a flat bottom hole at a given depth. From that one calibration point, an entire curve set can be drawn based on probe and material characteristics. Rather than plotting the entire curve set, instruments will typically display one curve based on a selected reflector size (registration level) that can be adjusted by the user. In the example below, the upper curve represents the DGS plot for a 2 mm disk reflector at depths from 10 mm to 50 mm. The lower curve is a reference that has been plotted 6 dB lower. In the screen at left, the red gate marks the reflection from a 2 mm diameter flat bottom hole at approximately 20 mm depth. Since this reflector equals the selected registration level, the peak matches the curve at that depth. In the screen at right, a different reflector at a depth of approximately 26 mm has been gated. Based on its height and depth in relation to the curve the instrument calculated an ERS of 1.5 mm.
 |  |