On November 26, 1971, Olympus predecessor Panametrics created their first-ever ultrasonic transducer. Below, you can see the transducer’s ‘birth certificate,’ identifying it as a 20 MHz, 1/4 in. element diameter immersion transducer, marked with the serial number "1." This transducer could have been used for thickness gaging or to detect very small flaws.
This probe’s ‘birth certificate’ is actually an early version of a test certificate, and our transducers still ship with a document that’s very similar.
Ultrasonic Transducer Test Certificates
Before a customer purchases a probe, it has to pass a series of performance tests so we know that it’s working properly. We characterize our transducers according to industry-standard techniques to ensure our probes meet our customers' expectations, as well as our internal standards. For every transducer we sell, we ship a test certificate with it and keep a separate copy for our records. Without these records, we wouldn’t be able to maintain the quality and consistency of our ultrasonic transducers that we've upheld for the past 48 years.
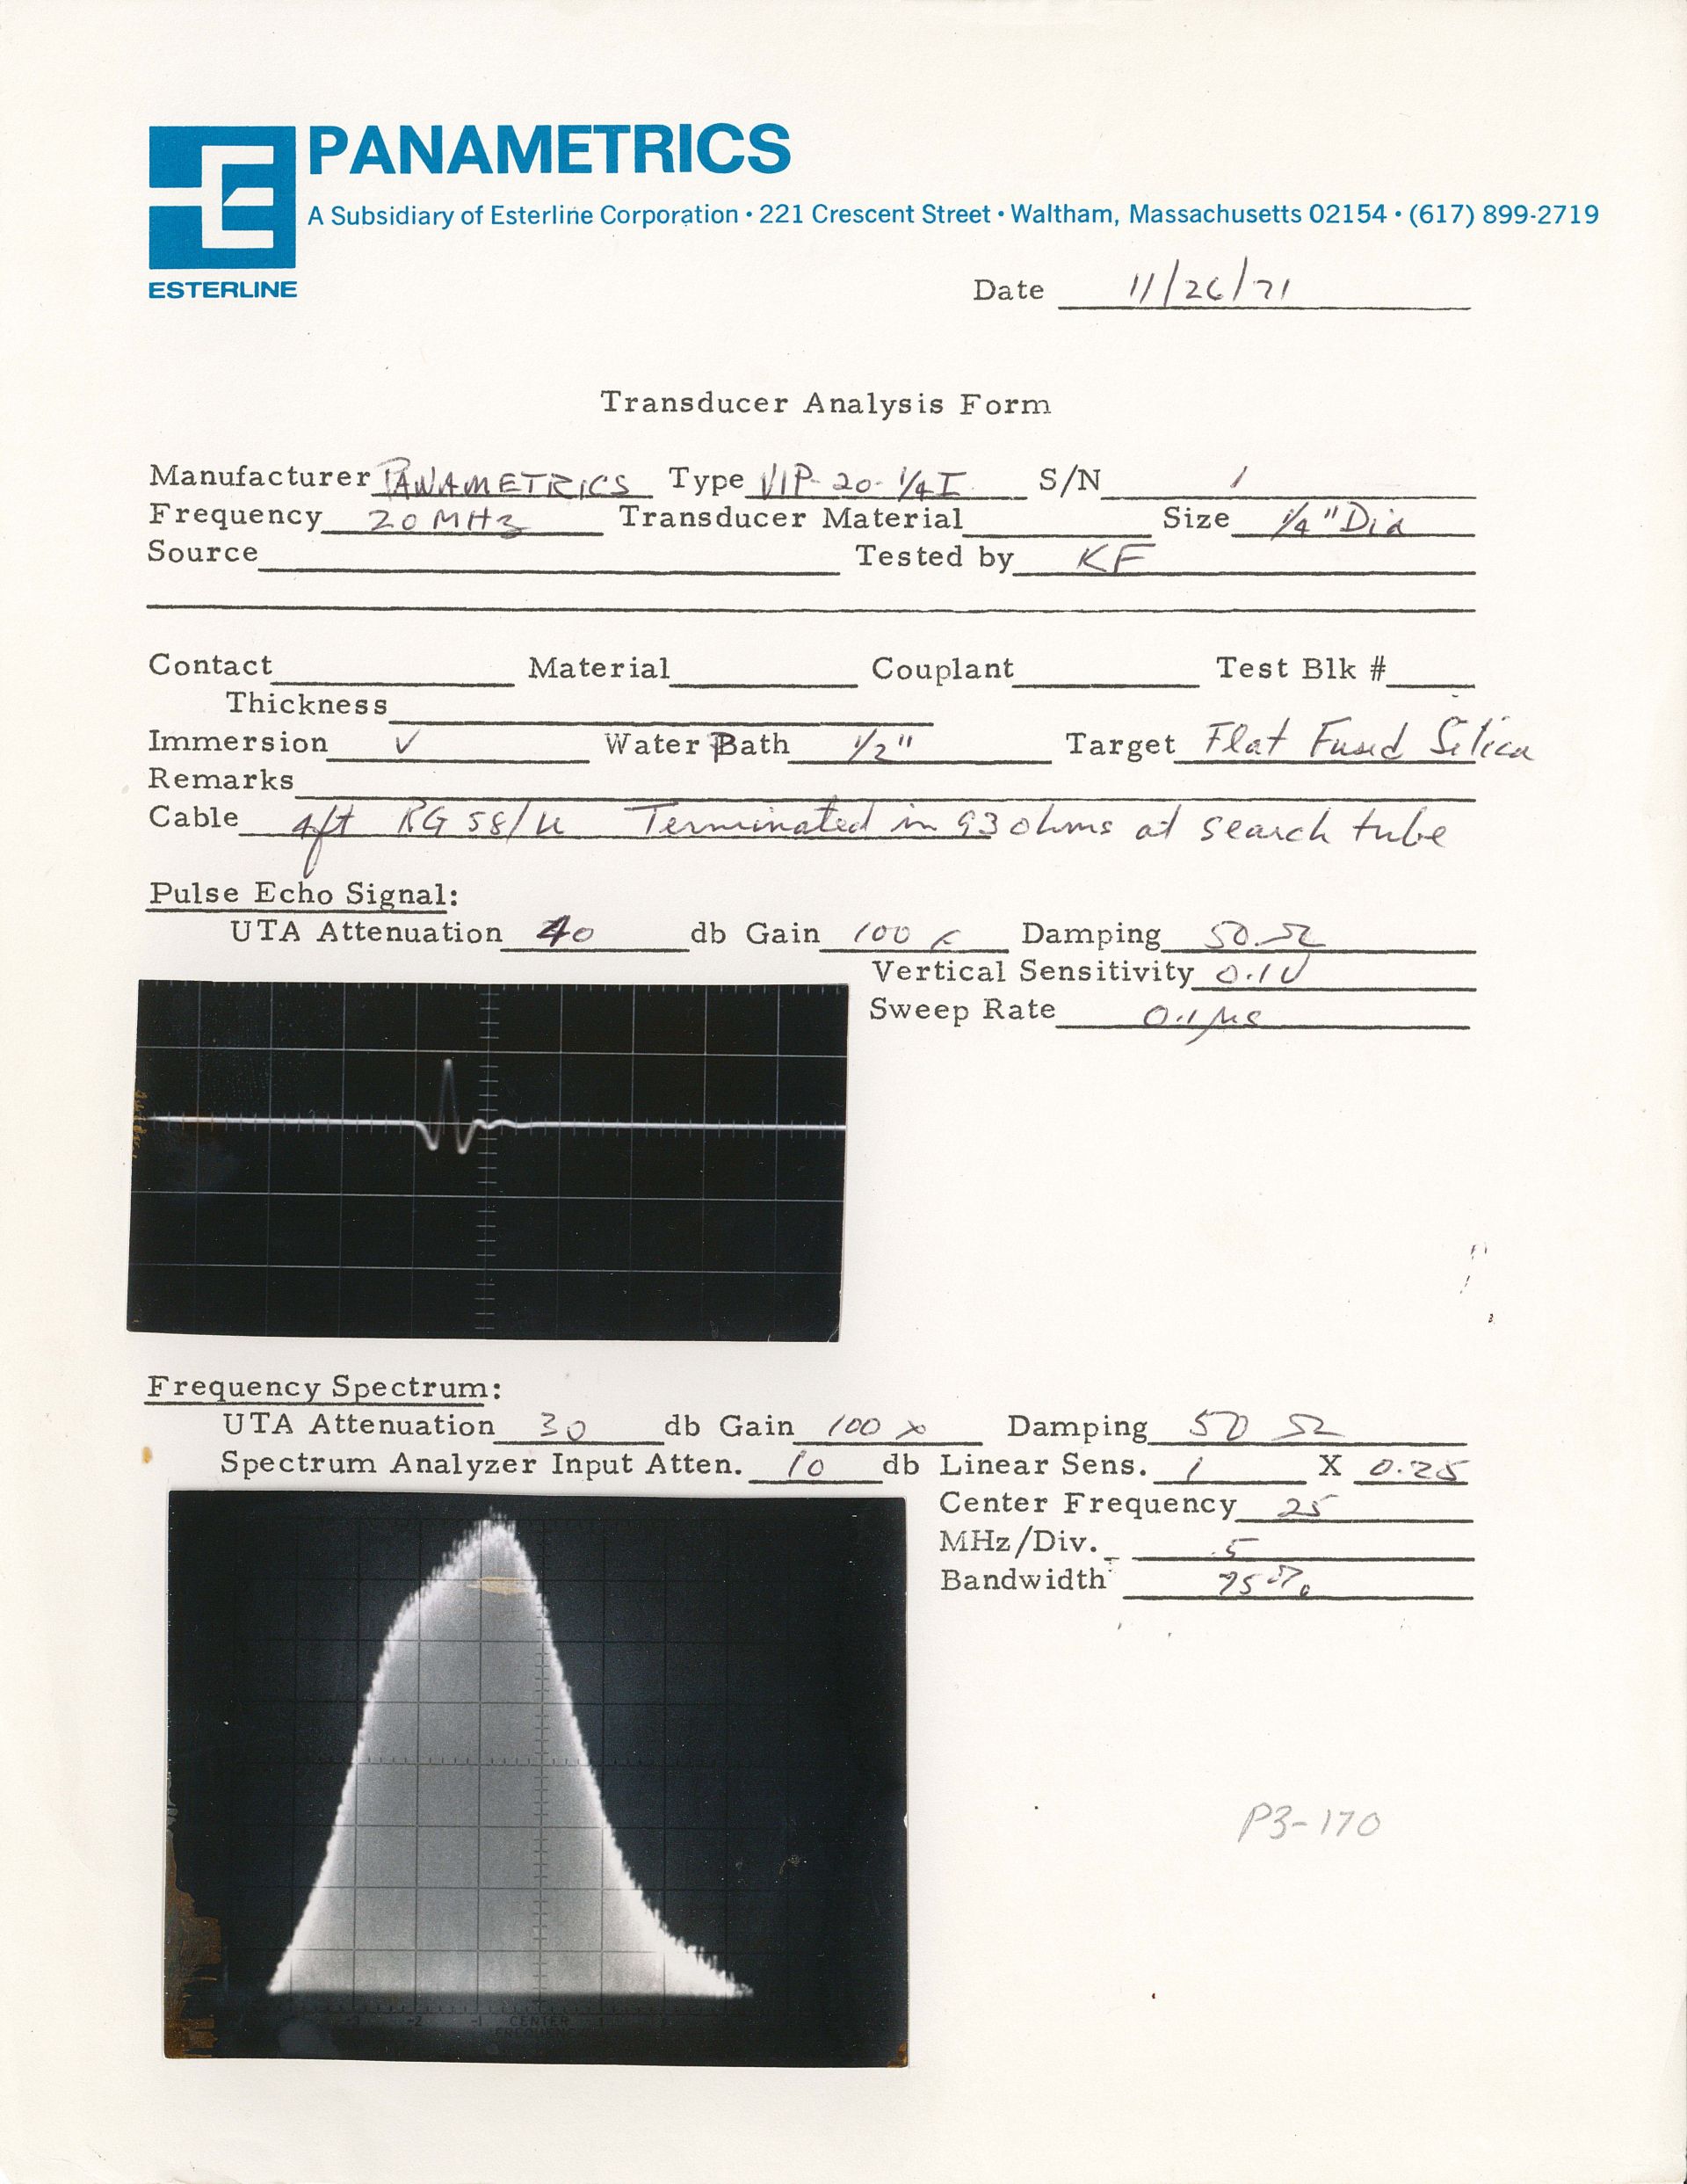
While this form is nearly 50 years old, the overall content is similar to our modern test certificates. We still include an example waveform captured off a known target reflector using specific equipment and test conditions. In this case, the example waveform was captured by submerging the probe in water and positioning it 1/2 in. away from a flat sheet of fused silica. The engineer performing the test, who signed the form as "KF," took a photo of an oscilloscope CRT (cathode ray tube) display and attached it to the form. We still include example waveforms on our test certificates, although they are now taken and stored electronically. This captured waveform is used to determine other performance indications of the probe. The instrument settings used to capture the waveform are listed above the waveform: gain was set to 40 dB, and the damping was set to 50.52 Ω. The vertical sensitivity was measured at 0.10 V, and the sweep rate or time scale was 0.1 µs.
The second attached photo shows the probe’s frequency spectrum. This image was compiled by sending the ultrasonic signal through a frequency amplifier, which outputs the signal as a series of narrow frequency bands. These signals are stacked together to create a visual representation of the frequency domain of this ultrasonic transducer. In this image, each screen division represents 5 MHz. The technician used this image to determine that the center frequency of the transducer is 25 MHz with a -6 dB bandwidth of 75%.
Sensitivity, center frequency, and -6 dB bandwidth are still the focus of our transducer characterization forms. Over the years, we've added a few extra parameters to give our customers more information about transducer performance. Our current forms also list the waveform duration, upper and lower -6 dB frequencies, and peak frequency. We also measure specific parameters for different probe types, including focal length, refracted angle, and zero offset.
Related Content
Two Challenges of High-Temperature Thickness Gaging and How We Solve Them
Did You Know? We Custom Manufacture Probes for Your Specific Applications
3 Steps to Make Your Worn Dual Element Transducer Like New
Get In Touch