Comparing standard cleanliness measurements
In the fourth of this six-part blog series, we explore how contamination levels are calculated, including defining cleanliness codes and testing maximum approvals. Here is where contamination level calculation fits into the overall technical cleanliness inspection process:
- Preparation
- Extraction
- Filtration
- Drying and Weighing
- Inspection
- Image Acquisition
- Particle Detection
- Particle Size Measurement and Classification
- Particle Count Extrapolation and Normalization
- Contamination Level Calculation
- Cleanliness Code Definition
- Maximum Approval Check
- Separation of Reflective and Nonreflective Particles
- Fiber Identification
- Results Review
- Reporting
Calculating the Contamination Level
For most cleanliness standards, an abstract number is displayed instead of the actual number of the measured (or extrapolated) particles. Next, the contamination level is checked for each particle size class. This is the second level of classification, but this time the particles are not classified according to their size. Rather, the classes are defined according to the number of particles in the class. These contamination levels enable the simple and rapid comparison of different cleanliness measurements, even if it’s sometimes an oversimplification.
Typical contamination levels are defined in the standard ISO 16232:
- Level 00: No particles per 1000 cm2 surface area
- Level 0: Less than 1 particle per 1000 cm2 surface area
- Level 1: More than 1, but less than 2 particles per 1000 cm2 surface area
- Level 12: More than 2000, but less than 4000 particles per 1000 cm2 surface area
These contamination classes are defined for most international standards. Up to 26 distinct levels can be defined, which will be measured for each particle size class. These contamination levels are usually similar for each size class (e.g., for ISO 16232) (Fig. 1), but they can be defined differently for each class (e.g., for SAE AS4059).
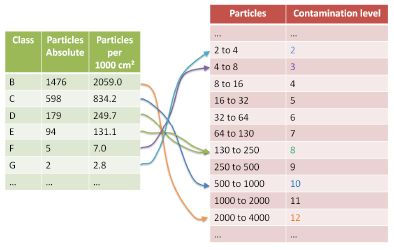
Figure 1: Example of contamination levels for ISO 1632 (A). Contamination levels are displayed in red.
Cleanliness Code Definition
Some standards reduce the representation of the measured product data to only a brief description. This cleanliness code is dependent on the standard and is composed of the size classes and the contamination levels of the found particles. Below (Fig. 2) is a cleanliness code example for ISO 16232 (A), which includes the following steps:
- Step 1: Detect and measure particles
- Step 2: Normalize and classify particles
- Step 3: Check contamination level
Note that this cleanliness code form is for the ISO 16232 standard only. Other standards define a different cleanliness code. The first “A” indicates the normalization to the sample surface area of 1000 cm2. Neighboring classes with the same contamination level can be combined.
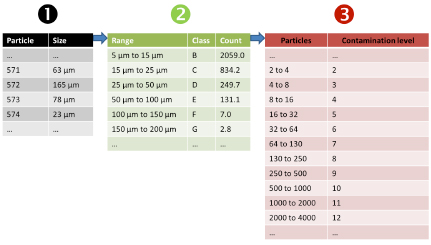
Figure 2: Example of a cleanliness code for ISO 16232 (A). The resulting component cleanliness code (CCC) for this example is A (B12/C10/DE8/F3/G2/HIJ00).
Maximum Approval Check
The actual purpose of cleanliness inspection is to measure contamination and to describe the results according to the selected standard. The approval and check of a maximum value is just an option and not always part of the cleanliness inspection process.
The maximum limit is specified in the inspection configuration. This may be the absolute number of particles or a maximum cleanliness code. This value is checked during the examination of the filter membrane, and it is indicated instantaneously when the maximum allowed value is exceeded. The operator is free to stop the measurement process completely and investigate the source of the contamination.
The following example (Fig. 3), created using OLYMPUS CIX technical cleanliness inspection software, shows the test for maximum approval while the filter membrane is scanned.
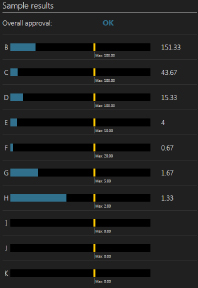 | 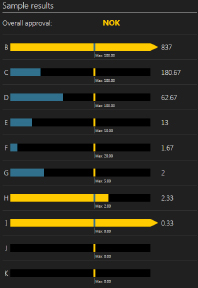 |
Figure 3: The image on the left shows the sample state after 2 minutes scan time, while every result is still OK. The image on the right shows the scan result 2 minutes later. There are now too many particles in size classes B, H, and I. Therefore, the overall approval is “NOK.”
Next up is the separation of metallic and nonmetallic particles and the identification of fibers. Check back for "Reflective/Nonreflective Particle and Fiber Identification," part five of six in our Breaking Down the Technical Cleanliness Workflow blog series.
Related Content
Breaking Down the Technical Cleanliness Workflow Part 1
Breaking Down the Technical Cleanliness Workflow Part 2
Breaking Down the Technical Cleanliness Workflow Part 3
Get In Touch