Separating metallic and nonmetallic particles and recognizing noncontaminant particles
In the fifth of this six-part blog series, we will review how to distinguish reflective (considered metallic) particles from nonreflective (considered nonmetallic) particles as well as how to identify fibers (noncontaminant particles). Here is where the separation of reflective and nonreflective particles and fiber identification fit into the overall technical cleanliness inspection process:
- Preparation
- Extraction
- Filtration
- Drying and Weighing
- Inspection
- Image Acquisition
- Particle Detection
- Particle Size Measurement and Classification
- Particle Count Extrapolation and Normalization
- Contamination Level Calculation
- Cleanliness Code Definition
- Maximum Approval Check
- Separation of Reflective and Nonreflective Particles
- Fiber Identification
- Results Review
- Reporting
Separation of Reflective and Nonreflective Particles
Metallic particles are much harder and have the potential to cause much greater damage than nonmetallic particles.
Metallic and nonmetallic particles are distinguished by how incident light reflects off them. The incident light on the filter membrane and the nonmetallic particles is scattered only diffusely. Regardless of the incident light, the "reflected" light is not polarized. Even if the incident light is polarized, there’s no effect when analyzing the polarization at the camera. The filter membrane is always brighter than the particles on it.
When the incident light hits a metallic particle, we can see a real reflection. (This reflection of light on a metallic surface does not change the polarization of the light.) This difference is exploited in the classical method of cleanliness inspection. The polarization of the reflected light can be analyzed at the camera—metallic particles get very bright when the polarizer and analyzer are set to parallel.
The classical method for detecting metallic particles requires two images (Fig. 1). The first image detects all particles, and the second image highlights the metallic particles. The analyzer must be rotated by 90° between the two image acquisitions. This is time-consuming and requires special adjustments and alignment of the two images.
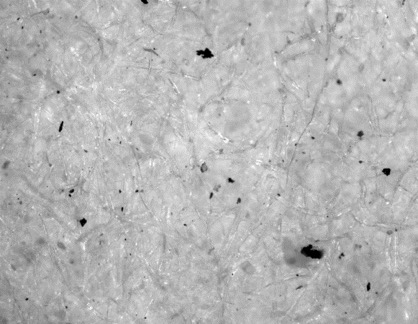 | 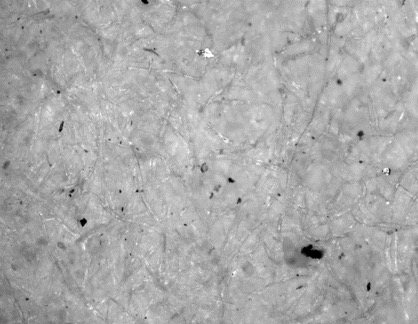 |
Figure 1: Left: Filter membrane with all particles detected and appearing as dark images. Right: Filter membrane with metallic particles appearing as lighter images.
New One-Image Process
Our CIX technical cleanliness inspection system features a novel method that collects all the necessary information in one shot. In this patented method, the incident light beam is polarized. One band of the light spectrum is changed in its polarization using a retardation plate; as a result, the polarization of the incident light is different for the different colors.
The diffuse reflection of nonmetallic particles on the filter membrane is identical to the classical setup (Fig. 2). The reflected light is nonpolarized in all color ranges and does not need to be analyzed. The filter membrane is brighter than the dark particles on it.
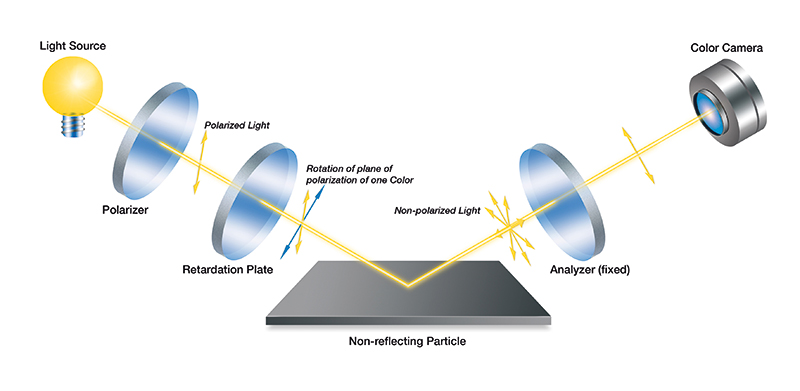
Figure 2: Diffuse reflection of nonmetallic particles with the Olympus CIX technical cleanliness inspection system.
The real reflection of metallic particles also follows the classical principle and preserves the polarization of light (Fig. 3). But because the polarization of each color is known, it’s possible to detect metallic particles directly in the color image—metallic particles get bright for a special color only.
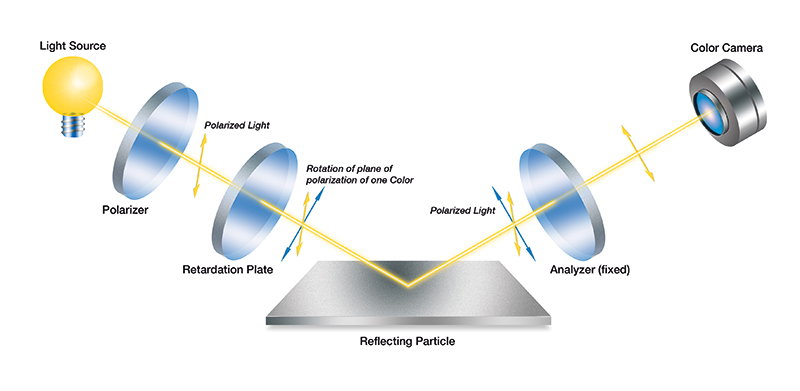
Figure 3: Real reflection of metallic particles with the Olympus CIX technical cleanliness inspection system.
With the CIX system, only one color image is required to separate reflective (metallic) and nonreflective (nonmetallic) particles. A second image acquisition in combination with the rotation of the analyzer is not necessary. This unique method offers a significant time advantage and utilizes robust construction without any moving and rotating mechanical parts.
Fiber Identification
Particles are impurities that are washed from the sample surface. Fibers, however, often have a different origin—such as work clothes, rags, or dust from the lab. Fabric fibers are usually not critical to the function of the technical component, so they should be recognized and counted separately when assessing a cleanliness examination.
A fiber is characterized by its elongated shape (Fig. 4). The aspect ratio of the length to the width is called fibrousness and must be in the range of 10:1 to 20:1 (depending on the standard being used). This means that the fibers must be significantly elongated (compared to other fiber measurements such as in asbestos investigation where individual fibers are straight like a needle but the fibrousness must only be 3:1). | 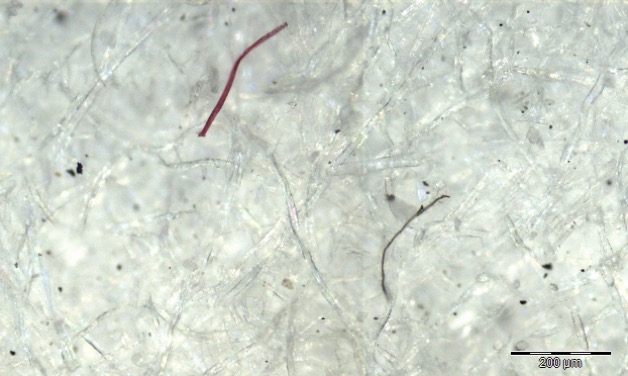 Figure 4: Visible fibers on a filter membrane characterized by their elongated shape. |
Fibers on a filter membrane might not be straight but folded. For this reason, a maximum Feret diameter measurement doesn’t provide a good result for fiber length (Fig. 5). As a first estimation, fiber length can be calculated as the ratio of its area and its maximum inner diameter (Fig. 5). This is possible if the fiber is presumed to have the same width over its whole length. | 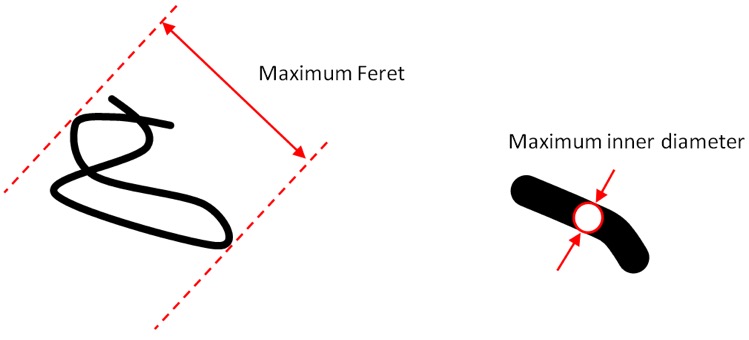 Figure 5: Left: A folded fiber and its maximum Feret diameter measurement. Right: A fiber’s maximum inner diameter. |
More precise measurements of fiber length follow the fiber’s skeleton and calculate the stretched fiber length (Fig. 6). This is very time-consuming and cannot be done for all detected fibers. | Figure 6: Stretched fiber length. |
Now that we’ve walked through all the steps in the technical cleanliness inspection process related to imaging and data collection, we’re ready to review our results and create data reports. Check back for "Results Review & Reporting," the final installment in our six-part "Breaking Down the Technical Cleanliness Workflow" blog series.
Related Content
Breaking Down the Technical Cleanliness Workflow Part 1
Breaking Down the Technical Cleanliness Workflow Part 2
Breaking Down the Technical Cleanliness Workflow Part 3
Breaking Down the Technical Cleanliness Workflow Part 4
Get In Touch