Ultrasound has been used for industrial nondestructive testing (NDT) for around a century. Early ultrasonic testing (UT) involved single-element transducers, a relatively simple technology that is still in use today and sufficient for many applications.
As time progressed, so did the technology. Improving both inspection performance and efficiency, advances were made using multielement probes and more powerful electronics and software. This resulted in phased array ultrasonic testing (PAUT), which is now a widely accepted and applied technique, although it requires more training than conventional UT to do it right.
The total focusing method (TFM) is another leap forward in complexity. It exploits multielement probe technology, but the data required for TFM is acquired using the full matrix capture (FMC) method. FMC is a more comprehensive beam firing and receiving strategy that results in impressive volumes of data.
Watch this short video to learn more about FMC and TFM basic principles
TFM imaging relies on processing this large amount of FMC data, so it’s gained a reputation for being a slower technique, only practical for secondary, more targeted verification. Having used and experimented with TFM for a while, I have some dos and don’ts to recommend to hopefully dispel some assumptions about this relatively new NDT method.
1. Avoid Assuming That One Mode Fits All
If you’re coming to TFM with a PAUT background like me, you are probably very familiar with the pulse-echo (P/E) technique. The beam paths are fairly easy to comprehend with pulse-echo. In a P/E first-leg inspection, the sound beam pulses from the probe, travels to the flaw, reflects off the flaw, and travels back to the probe. In a second-leg inspection, there is an extra bounce off the back wall.
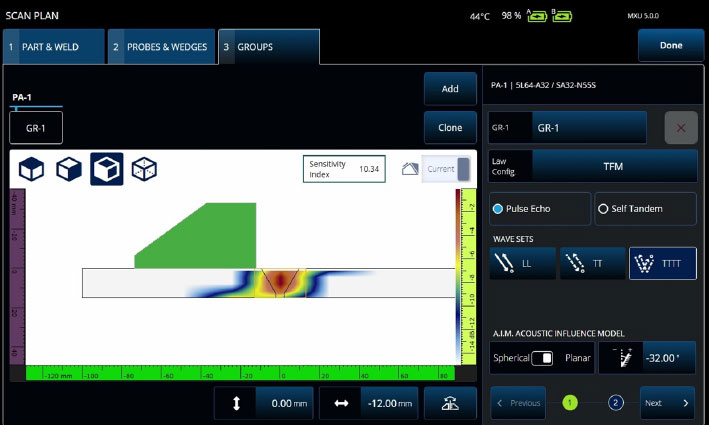
With TFM, the concept of beam paths is not so straightforward. To produce a TFM image, the beam paths are synthetically regenerated by the acquisition instrument using the FMC data. By combining different wave types (longitudinal or transversal) and different legs of the waves’ paths, the instrument provides you with up to as many as 10 options for TFM modes (also known as wave sets)—for example, TTT, TLT, or TTTT.
To decipher these TFM wave sets, know that each letter represents a leg of the journey and the mode of propagation for that leg—T for transversal or L for longitudinal. TFM wave sets can have extra bounces that we’re not used to seeing with phased array pulse-echo. Some instruments, such as the OmniScan X3 flaw detector, even have an option for a 5T wave set (TT-TTT).
With all these options, how do you pick the right wave set (or wave sets) for your inspection? Here are some important factors to consider:
- Flaw type
- Flaw location
- Curvature or part geometry
These characteristics, both of the targeted flaw and the inspected part, influence the detection capability of each wave set.
To demonstrate this, I have provided examples of different TFM images of an ID crack of a weld.
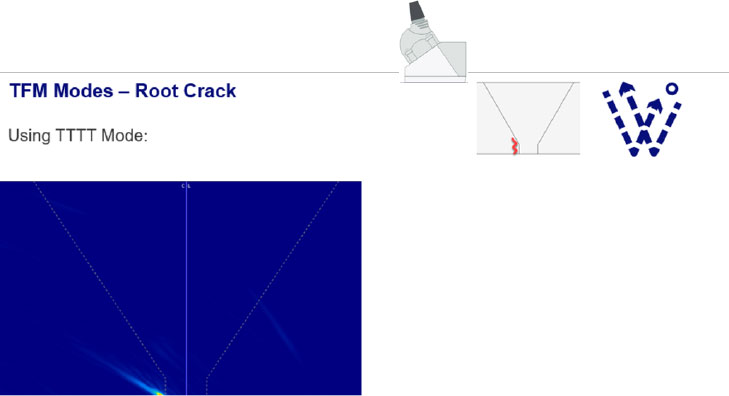
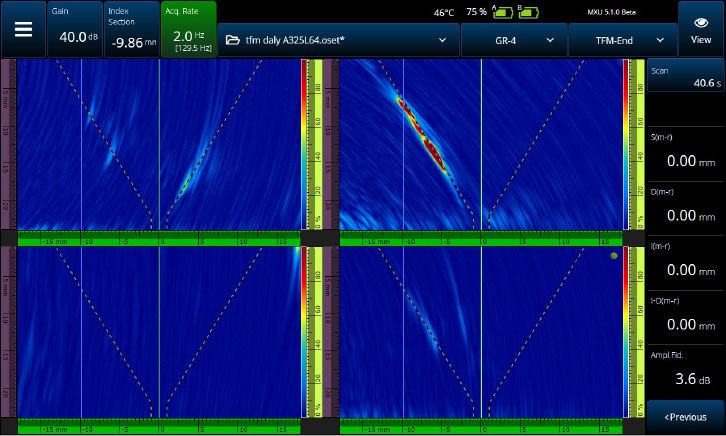
My first example shows the signal response on the OmniScan X3 display when using a TTTT wave set in pulse-echo mode (similar to a PAUT second-leg inspection).
Although something is detected, the signal is not optimal, and there is a chance this indication might be overlooked. Now, if we switch to the TTT wave set in self-tandem mode on that same ID crack, suddenly the indication “pops” on the display!
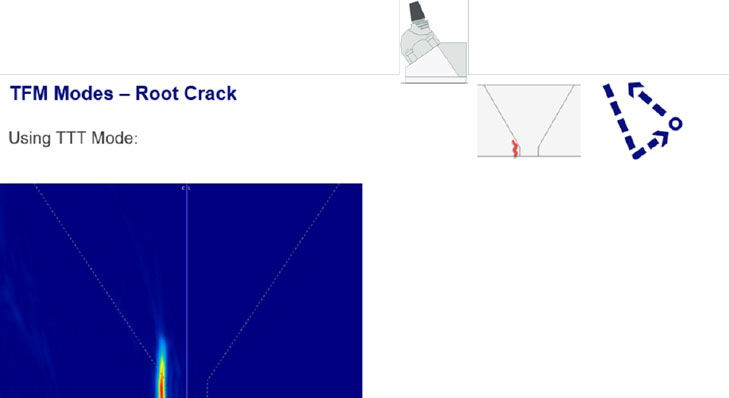
In this case, the sound wave bouncing off the back wall prior to hitting the ID crack reflector has a much greater perpendicularity to the flaw, so the TTT wave set images it beautifully! (Just like with conventional UT, you want a reflection as close to 90° as possible.)
For the ID crack, these two different TFM modes provided radically different detection results. The same is true for different reflectors at different depths and in different orientations. One mode is often not enough to cover all the scenarios.
Bonus Tip: Make Sure Your Velocity and Thickness Parameters Are Accurate
Here again, if you’re coming from a PAUT background, you may be in the habit of estimating the sound velocity of the material. You might be tempted to input the standard 0.2320 in./µsec or 5890 m/sec and call it a day. However, with TFM, especially when using self-tandem modes with all those extra bounces, we can’t afford to hazard a guess.
For proof, look what happens with 2.5 % variations when trying to detect an ID crack using the TTT wave set.
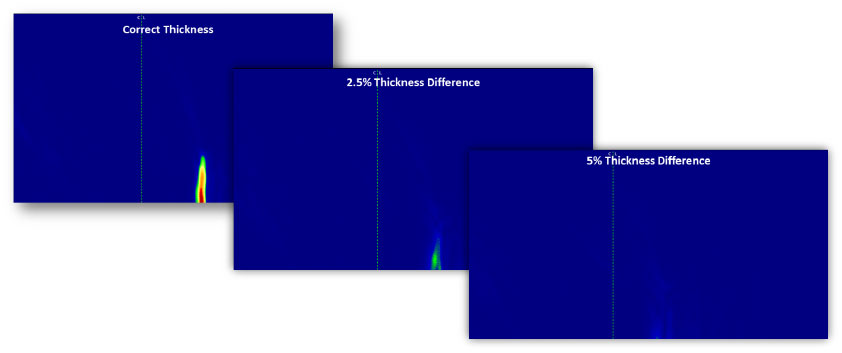
A 5% difference in the velocity value for the half-skip (TTT) resulted in a complete loss of signal on the vertical notch. This demand for accuracy also applies to part thickness and geometry. If the input thickness and geometry values are inaccurate, the signal no longer bounces where expected, which results in calculation inaccuracies.
2. Ensure You Have the Right Probe to Focus Your TFM Zone
Total focusing method (TFM) imaging also has a reputation for providing even focus throughout the entire TFM zone. However, this is not entirely true. TFM is subject to the same laws of physics as phased array and conventional UT. For instance, your instrument’s TFM imaging performance depends on the phased array probe’s capabilities.
Just like in PA and UT, a probe’s physical characteristics such as its element size and frequency have a role to play in its beam characteristics (i.e., near-field length, beam diameter, beam spread angle, etc.), which also have an impact on focusing in the TFM zone. Look at the TFM images of stacked side-drilled holes (SDHs) below, acquired using three different probes:
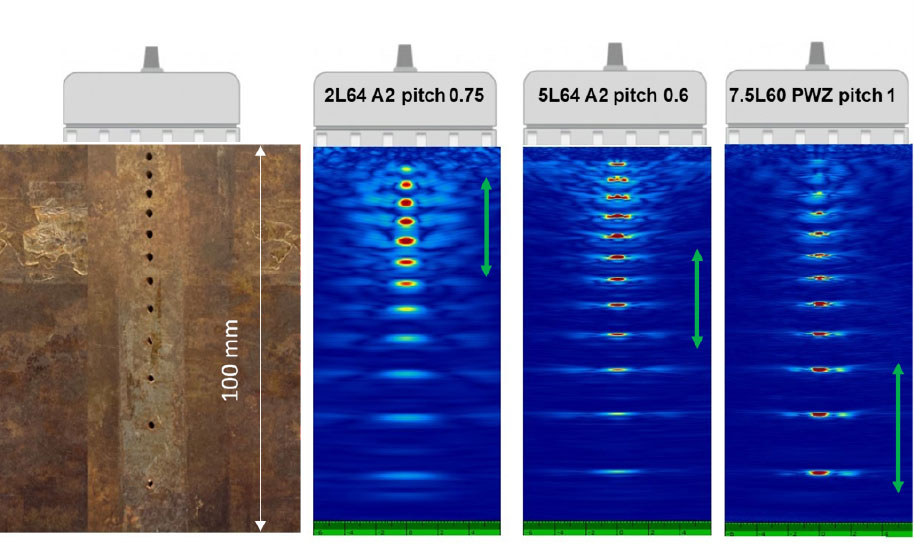
Learn more about the impact probe selection has on TFM in blog post "Which Phased Array Probe Is Right for Your Total Focusing Method Inspection?”
3. Don’t Underestimate the Importance of Amplitude Fidelity
What is amplitude fidelity, and why is this term a TFM buzzword?
Amplitude fidelity (AF) is the measurement (in dB) of the maximum amplitude variation of an indication caused by the TFM grid resolution. In plain English: this value determines how coarse the grid can be before your image quality becomes too pixelated to clearly see flaws. By adjusting the AF, you are trying to make sure that the size of the pixel fits the size of the wavelength. The size ratio of a pixel versus the wavelength of the ultrasonic beam is important. Like when your digitizing frequency is too low in PAUT, you might miss the peak of the signal, in TFM, too large a pixel might mean that won’t see an indication’s peak amplitude.
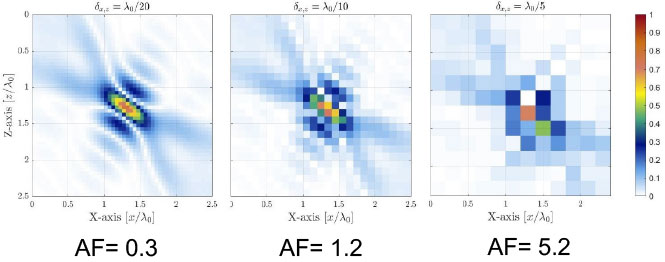
There are multiple factors that influence your amplitude fidelity: probe frequency and bandwidth, material velocity, grid resolution, applied envelope, and so on. Inspection codes governing TFM (ASME’s, for example) usually recommend an amplitude fidelity that does not exceed 2 decibels (dB).
How do you know if your AF has exceeded the optimal level? Easy: Just look at the AF reading as instruments such as the OmniScan X3 flaw detector calculate it for you. Furthermore, the OmniScan X3 unit’s TFM envelope feature enables a faster acquisition rate than standard, oscillating TFM rendering, while maintaining an optimal amplitude fidelity (AF) setting, so make sure to try the envelope the next time you’re struggling to get the right AF!
Learn all about our innovative TFM envelope in this white paper “Use of the Total Focusing Method with the Envelope Feature.”
4. Take Full Advantage of Wave Path Simulator and Modeling Tools
Use all the software tools at your disposal to predict the outcome of your TFM inspection.
Before you start your TFM inspection, verify the achievable coverage and sensitivity for a given probe, wedge, and wave set combination using a simulator such as the Acoustic Influence Map (AIM) modeling tool. The AIM tool also takes into account the targeted flaw type and the probe’s angle offset. Use it to check all wave sets and test each one on different reflectors until you find the best one.
The colors of the AIM amplitude map give you a clear indication of the coverage the TFM wave sets will provide in the region of interest (ROI).
Red areas mean that the ultrasonic response is very good and varies between 0 dB and −3 dB with respect to the maximum amplitude. Orange areas vary between 3 dB and −6dB from the maximum amplitude. Yellow areas between −6dB and −9 dB, and so on.
Learn more about using AIM by watching this webinar: Acoustic Influence Map (AIM)—The Modeling Tool for Your TFM Inspection.
5. Use Multiple Modes to Optimize Your Coverage
Last, but not least, some instruments enable you to use multiple modes at the same time! For example, you can run and display the results of up to four TFM modes simultaneously on the OmniScan X3 screen. Use this to your advantage to help make sure you don’t miss any unsuspected flaws!
If you’re hungry for more, check out these Frequently Asked Questions about TFM.
Related Content
Bookmark This! Access Our Total Focusing Method (TFM) Resources in One Convenient Location
Application note: Using the Total Focusing Method to Improve Phased Array Ultrasonic Imaging
White paper: Use of the Total Focusing Method with the Envelope Feature
Get In Touch