Overview of the Acoustic Influence Map and the Sensitivity Index
The Acoustic Influence Map (AIM) introduced in the OmniScan™ X3 flaw detector is a valuable software assistance tool for the setup of total focusing method (TFM) scan plans. AIM predicts the acoustic beam coverage for each combination of wave propagation paths (wave sets) so the inspector can optimize the TFM scan plan to increase the probability of detection. However, since each AIM map is self-normalized and displayed in a logarithmic amplitude scale from 0 to −15 dB, it is not possible to infer from the AIM maps alone the relative acoustic sensitivity between different TFM scan plans. To facilitate this comparison, the sensitivity index is displayed on top of all AIM maps.
How to Use the AIM Sensitivity Index
The sensitivity index is simply the maximum amplitude of each AIM map prior to normalization and is displayed in arbitrary units that are proportional to the predicted voltage amplitude at reception. By combining the information of the AIM maps along with their sensitivity indices, users can compare the acoustic sensitivities of different TFM inspection setups.
An Illustrative Example
In this application note, we will present an example for the selection of the optimal TFM inspection mode for a given inspection scenario based on the information provided by AIM and the sensitivity index. Although the example is focused on the selection of the optimal TFM mode, the procedure introduced can also be used to assist the selection of the probe and wedge combination for a predetermined TFM mode.
For this example, our objective is to select the optimal TFM mode for the inspection of a surface-breaking crack in a 25 mm thick flat bar using a 5L32-A32 probe coupled to a SA32-N55S angled wedge. We limit our search to self-tandem modes because in general they are more suitable for producing “true to geometry” TFM images of vertical cracks. In the current version (5.1) of the OmniScan™ MXU software there are 7 available self-tandem modes and their corresponding AIM maps are presented in Figures 1 to 7. For these AIM maps we have selected the planar defect mode with a defect angle of 0° to match the expected orientation of the surface-breaking crack.
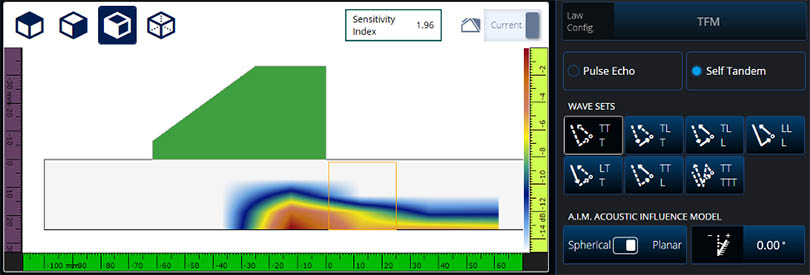
Figure 1: Planar AIM map for TT-T mode
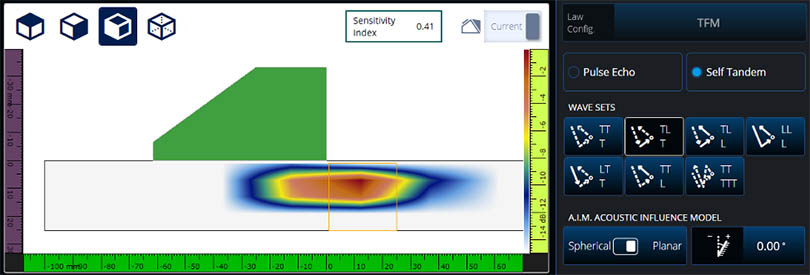
Figure 2: Planar AIM map for TL-T mode
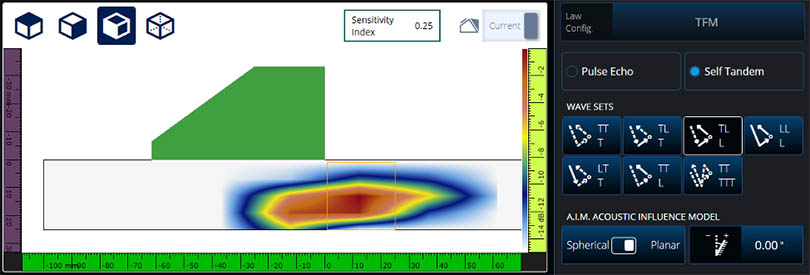
Figure 3: Planar AIM map for TL-L mode
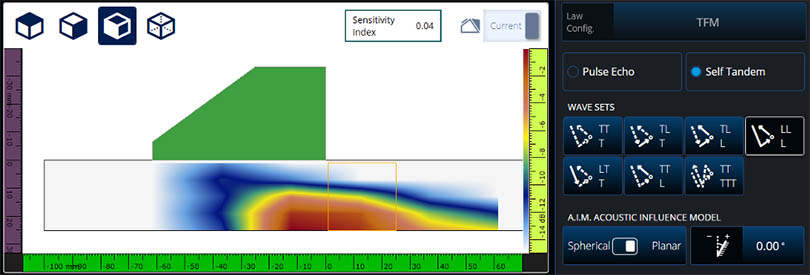
Figure 4: Planar AIM map for LL-L mode
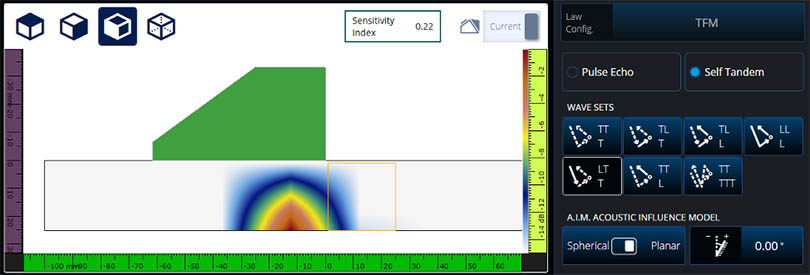
Figure 5: Planar AIM map for LT-T mode
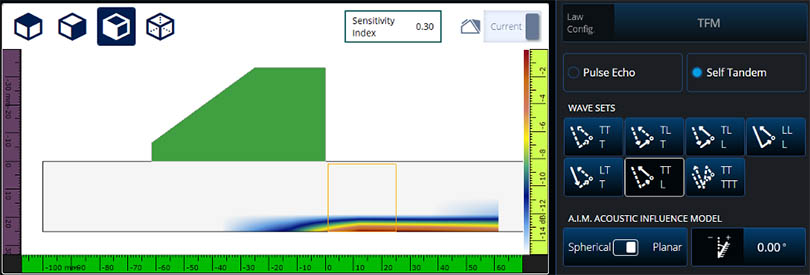
Figure 6: Planar AIM map for TT-L mode
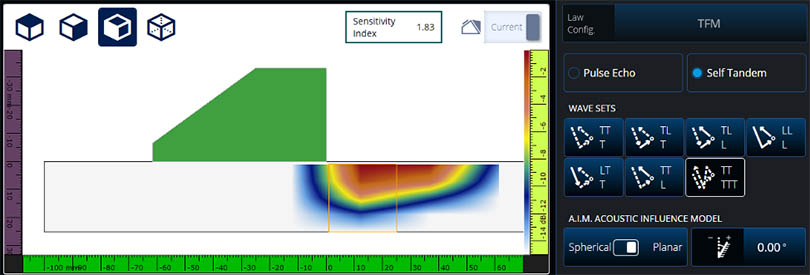
Figure 7: Planar AIM map for TT-TTT (5T) mode
Comparing the Sensitivity Indexes of TFM Wave Sets
From the AIM maps, we see that the TL-T and TT-TTT (5T) modes are likely the optimal modes for this inspection scenario since they have the best acoustic coverage near the upper surface of the bar. Comparing their sensitivity indices, we see that the 5T mode has a sensitivity index of 1.83 whereas the TL-T mode has a sensitivity index of 0.41. Based on this information, we would expect the 5T mode to have approximately 4.5 times better signal-to-noise ratio (SNR) compared to the TL-T mode. The experimental TFM images acquired using these two modes are presented in Figure 8.
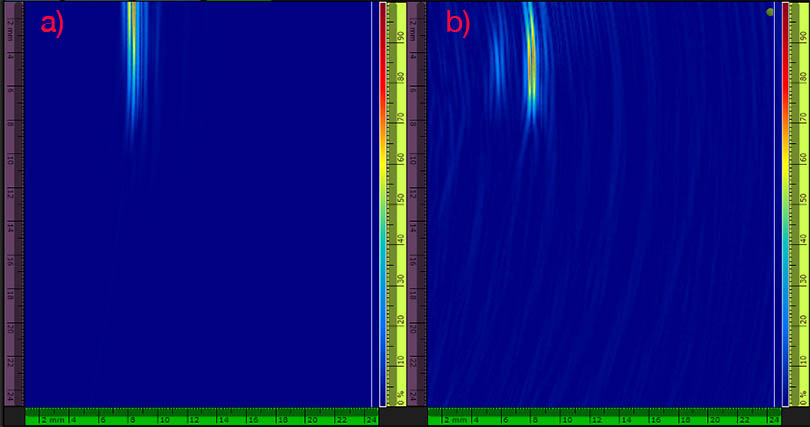
Figure 8: TFM images obtained using a) 5T mode and b) TL-T mode. Analog gain of 16 dB used in a) and 35 dB used in b).
In Figure 8, the analog gain values for the 5T and TL-T modes were set respectively at 16 dB and 35 dB so that the peak amplitude values for both modes are at 80%. Consequently, the 5T mode has 19 dB (~8 times) better acoustic sensitivity compared to the TL-T mode. This is also evident from the lower level of background noise present in the 5T TFM image. The difference in acoustic sensitivity measured experimentally and predicted by AIM sensitivity index can be attributed to the deviation of a real crack from an ideal planar reflector. From Figure 8, we also observe that the 5T mode is more accurate in representing the surface-breaking nature of vertical crack, as was predicted by the AIM maps shown in Figures 2 and 7.
Summary of the Procedure for Selecting the Optimal TFM Mode Using AIM
The above example demonstrates that AIM can accurately model the acoustic coverage of a given TFM mode and the sensitivity index can be used to predict the relative acoustic sensitivity between different TFM modes.
A summarized procedure for selecting the optimal TFM mode is as follows:
- Generate AIM maps for all TFM modes that are relevant to the inspection configuration. Ensure that the proper defect setting is selected (e.g. spherical vs. planar, orientation of planar defects).
- Select a subset of TFM modes for which their corresponding AIM maps provide adequate acoustic coverage in the region of interest. Multiple complementary TFM modes may be necessary to cover different portions of the region of interest.
- From the subset of TFM modes, select the mode(s) with the highest AIM sensitivity index.