|
|
Meter cover (measurement of the surface, at the site marked with the red circle) | |
Application - Evaluating the Roughness of a Speedometer Cover with Microscopic Precision
Displays, which are used in a wide variety of situations, are commonly viewed through a resin/glass panel or a filter. Depending on the viewing environment, glare from the display's lighting or glare on the display's surface can interfere with visibility, which is the case with automobile speedometers. To help alleviate this problem, automotive manufacturers perform an anti-glare (AG) treatment that adds minute concavities and convexities on the surface of the panel or filter.
Functional evaluations of panels and filters with anti-glare measures are usually by subjective visual inspections. However, this method gives rise to the problem that quantitative evaluation is difficult due to its susceptibility to variation. Various quantitative evaluation methods have been attempted, including roughness measurement. Within surface roughness evaluation, the arithmetic mean heights (Ra, Sa) are among the parameters most widely used. These mean height parameters represent the mean value of height differences from the mean level in the measurement target area, Ra for the roughness profile and Sa for the 3D roughness.
Limitations of Sa and Ra Quantification of Surface Roughness
While Sa provides excellent evaluation reproducibility without being affected by interferences, such as scratches and dust, it cannot always fully capture the surface characteristics. When visually comparing the three-dimensional roughness of surfaces, the results often show little difference in the values even if the specimens clearly differ from each other. And, while contact-type surface roughness testers are commonly used to measure Ra, they also present some problems:
- They provide limited information as only a one-line cross-section is used for the measurement.
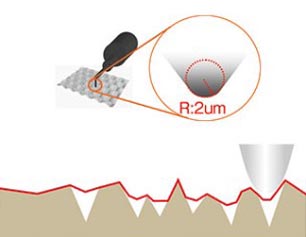
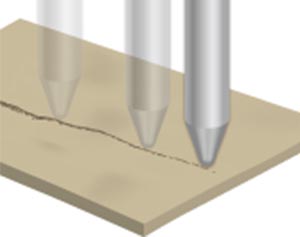
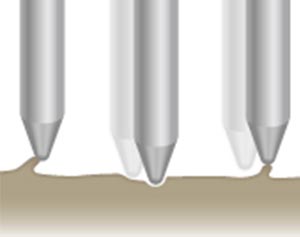
- They cannot provide accurate measurements in the presence of concave-convex shapes that are finer than the diameter of the needle at the stylus tip.
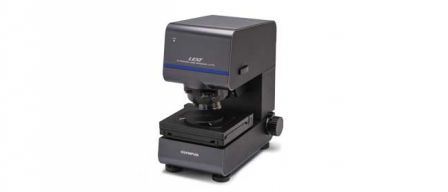
Measuring the Roughness of Speedometer Covers Using the LEXT OLS5000 3D Laser Microscope
The capacity to gather more complete and informative surface-roughness data using the LEXT OLS5000 3D laser scanning microscope gives automotive manufacturers the ability to evaluate the surface roughness of speedometer coverings with much greater precision.
[1] Measure Micro-Roughness with High Accuracy
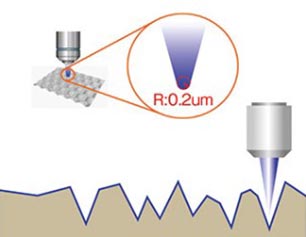
Olympus' LEXT OLS5000 microscope uses a laser beam with wavelength of 405 nm and diameter of 0.4 µm for surface measurement. Since the diameter of the laser beam is much smaller than that of the stylus tip on conventional contact-type surface-roughness testers, it can capture finer concave-convex shapes on the panel surface.
Contact-type surface-roughness tester |
LEXT OLS5000 laser microscope |
Moreover, as the laser microscope provides optical noncontact measurement, it does not damage the specimen surface.
|
|
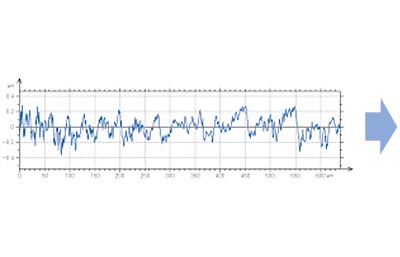
The laser scanning microscope also enables you to collect a far larger amount of data compared to stylus roughness testers. Whereas contact-type surface-roughness testers can only collect information by tracing a single line along the measurement plane with the measurement probe, the LEXT OLS5000 microscope can provide area data obtained by scanning with the laser beam.
One-line cross-sectional data obtained by contact-type surface-roughness tester |
Surface roughness data, including a height image, provided by laser scanning |
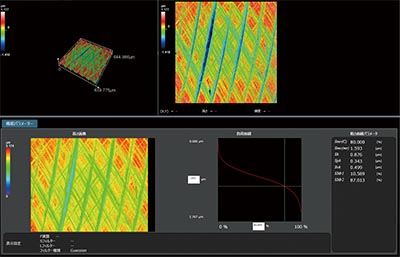
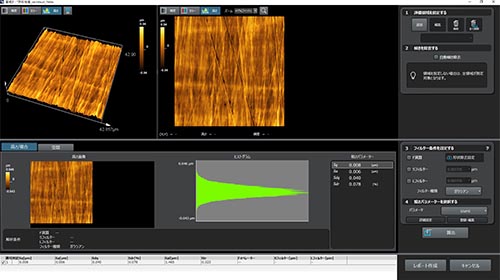
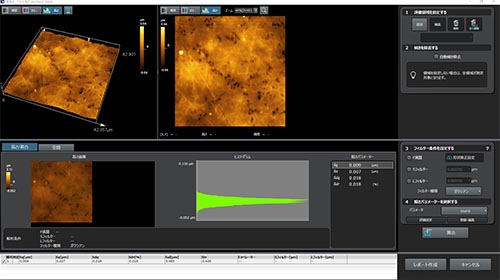
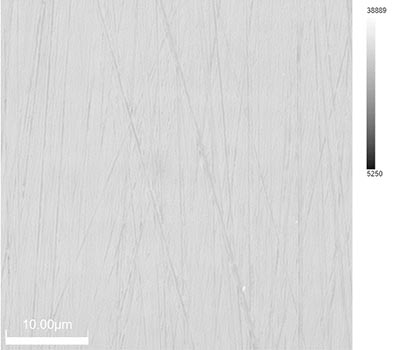
Using a LEXT OLS5000 laser scanning microscope, we acquired the concave-convex shapes of an automotive speedometer cover with an AG coating on the surface (high/low anti-glare type). The laser microscope provides a height image where the lighter and darker areas represent higher and lower areas, respectively. Contrary to the data provided by a one-line cross-sectional profile alone, obtained using contact-type surface-roughness tester, this image makes it possible to collect information from wider concave-convex shapes as area data.
High anti-glare characteristic |
Low anti-glare characteristic |
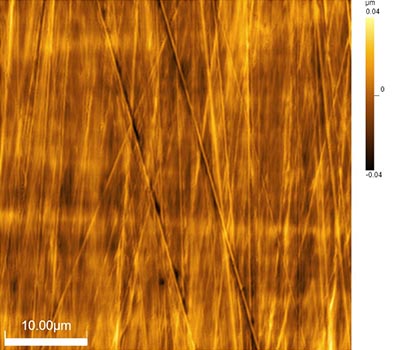

The two images shown above present visually clear differences.
We then quantitatively evaluated these roughness images using surface roughness measurement data provided in the LEXT OLS5000 microscope’s measurement screen.
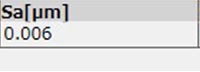
First, we examined the arithmetic mean height (Sa):
High anti-glare characteristic
|
|
Low anti-glare characteristic
|
|
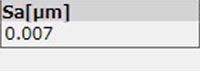
Sa, which is typically the method used, shows little difference.
Next, we focused on the auto-correlation length (Sal)*1:
High anti-glare characteristic
| Low anti-glare characteristic
|
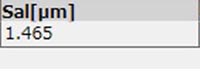
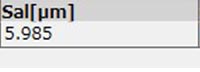
*1 Auto-correlation length (Sal): This numerically represents the density of concave-convex shapes on the surface (e.g., folds and particles) in the unit of length. In other words, this parameter focuses on the “horizontal direction,” instead of the “height direction,” of concave-convex shapes. Smaller values indicate steeper surfaces, while larger values show the dominance of moderate concave-convex shapes. Auto-correlation is a measure of how similar (or distant) the roughness image shifted in the horizontal direction (x, y) is to (from) its original image.
The results revealed a large difference in Sal between the two data. The coating with the high anti-glare characteristic shows a smaller value, indicating the dominance of small and steep concave-convex shapes (i.e., high density, fine-grained).
Finally, we examined the root mean square gradient (Sdq)*2 and the developed interfacial area ratio (Sdr)*3:
*2 Root mean square gradient (Sdq): A parameter representing the mean value of local gradients, which indicates the steepness of concavities and convexities on the surface.
*3 Developed interfacial area ratio (Sdr): A parameter representing the rate of increase in the surface area, the value of which increases for finer and rougher surface shapes.
High anti-glare characteristic
| Low anti-glare characteristic
|
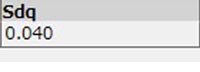
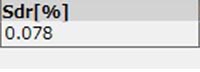
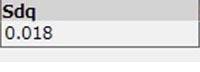
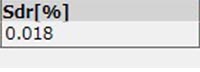
The differences were detected by focusing on these parameters, in addition to Sal, as indirect evaluation indices representing how fine-grained the surfaces were. Larger values of the inclination angle of the local gradient and surface area ratio indicate more finely grained surfaces.
The parameters mentioned above are summarized by the following relations
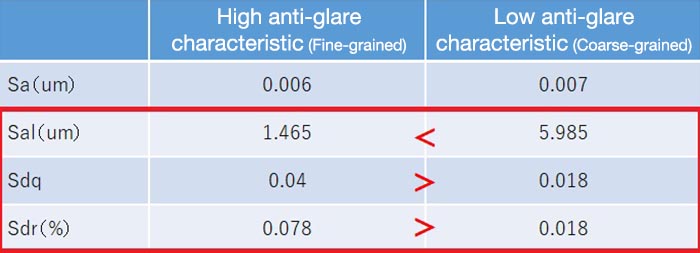
As the table above indicates, in the quantitative evaluation using surface-roughness measurement the apparent differences in the roughness images are not revealed by the height direction (Sa) parameter, but are reflected by the parameters of other indices, including the horizontal dimension (Sal), local gradient (Sdq), and surface area ratio (Sdr).
[2] Laser Differential Interference Contrast (DIC) Observation for Impressively High Resolution
The greatest advantage of laser microscopes, in addition to capturing roughness images (height images), is that they can also produce luminance images, which express the intensity of the laser beam reflected by the specimen in the same region. Although the laser light, which has a single wavelength, provides monochrome luminance information, it is possible to obtain high-contrast images without the superposition of blurry images thanks to the effect of the confocal optical system. In the presence of nano-level concavities and convexities on the specimen surface, you can obtain clear, higher contrast images that are close to the resolution of an electron microscope by adding differential interference contrast (DIC) observation to high-contrast images. This makes it possible to optically view extremely small concavities and convexities that are difficult to see with normal luminance images, enabling you to carry out real-time observation without having to capture images.
High anti-glare characteristic
| Low anti-glare characteristic
|
Normal luminance images | |
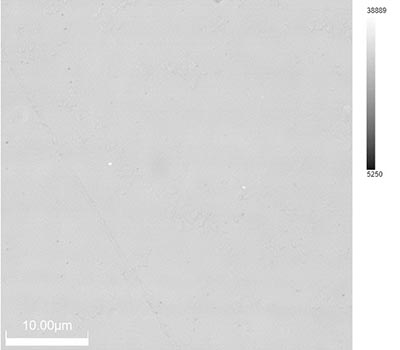
|
|
DIC luminance images | |
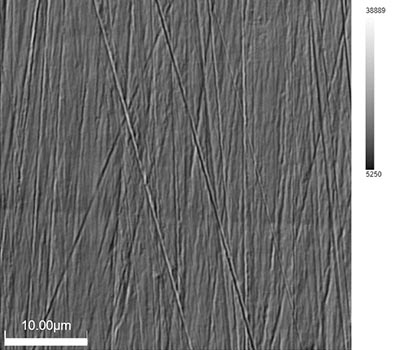
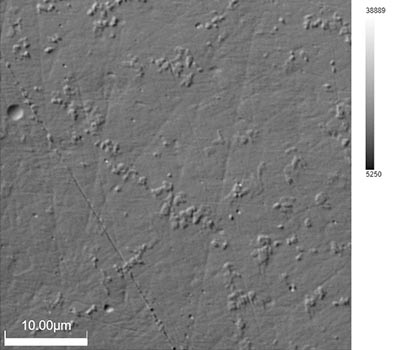
By adding DIC observation, you can see minute concavities and convexities on the panel and clearly distinguish the differences in the surface state between specimens to such an extent that it is hard to believe you are observing the same region.