The Importance of Cast Iron Analysis
In the metallographic laboratory, analyzing cast iron for graphite nodularity, size, form, and distribution parameters, as well as the ferrite-to-pearlite ratio, is important from a quality control perspective.
In another example, an automotive manufacturer chose ductile iron for the suspension arm of a sports car. Originally, the engineers considered aluminum alloys but realized their lower strength would make the suspension arm too large. Ductile iron was ultimately chosen due to its unique mechanical properties: it reduces noise and weight while lowering cost. In this case, if the quality of the material does not meet the manufacturer’s strict quality control specifications, the car's suspension performance may be compromised. Fierce competition on the racetrack and from automotive manufacturers means engineers must take quality control of these high-performance automotive components very seriously. |
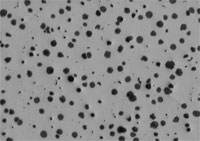
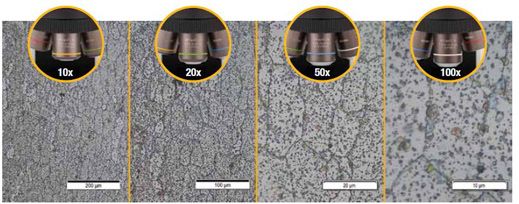
Graphite in cast iron at 100X magnification |
Evaluating the Microstructure of Graphite in Cast Iron
To meet high quality standards for manufactured components, metallographic laboratories often analyze the microstructure of cast iron for the following characteristics:
- Graphite type (form)
- Graphite distribution
- Graphite size
- Graphite nodularity
- Percentage of graphite
- Percentage of ferrite-to-pearlite
Some of the commonly used international standards for cast iron analysis are ASTM A247 (US), ISO 945 (global), ISO 16112 (global), JIS G-5502 (Japan), JIS G 5505 (Japan), KS D 4302 (Korea), GB/T 9441 (China), NF A04-197 (France), and ASTM E2567 (US). Although several international standards exist, ASTM A247 is the dominant standard within North and South America used to evaluate the microstructure of graphite in cast iron. This standard presents three parameters: graphite type (also called form), graphite distribution, and graphite size. The graphite type, or form, varies from I to VII. Type I indicates nodular (ductile—graphite in form of nodules) cast iron, whereas Type VII indicates gray cast iron (graphite in form of flakes). Graphite distribution varies from A to E and is mainly used to rate Type VII graphite. Size of graphite varies from 1 to 8, whereas the lower number indicates the larger size.
Classification according to the form of graphite gave origin to a term called nodularity, which indicates the percentage of graphite in nodular form. For example, cast iron rated at 100% nodularity contains all its graphite in the form of nodules (Form I graphite), whereas 80% nodularity means that the cast iron contains 80% of nodules and 20% of other form(s) of graphite.
The percentage of graphite, ferrite, and pearlite, respectively, indicates the amount that each structure represents of the total material. Determination of these parameters is a classic example of the evaluation of the percentage of an area.
Historically, most quality control laboratories analyzed cast iron using the chart comparison method. With this method, an operator performs a visual estimation of the parameters by comparing a live image under an optical microscope (typically at 100X magnification) to micrograph charts, often posted on the wall near the microscope. Because cast iron is typically analyzed according to several parameters, comparison to various charts can be time consuming. Since the results are interpreted by the operator, this method can produce inaccurate and unrepeatable results, often not reproducible between different operators. Also, quality control technicians are required to manually enter their results into a computer-based spreadsheet or report, providing another opportunity for errors.
So how can quality control laboratories perform a cast iron analysis that meets full compliance with ASTM A247, or other international standards, and reduces the risk of inaccuracies and subjectivity? The answer is a turnkey, fully automated analysis solution for cast iron.
Digital Image Analysis of Cast Iron in Compliance with ASTM A247 and Other Standards
Enter the modern digital metallurgical quality control laboratory. Thanks to advancements in materials science software for metallurgical microscopes, operators can leverage image analysis to analyze cast iron in compliance with ASTM A247 and a wide variety of international standards. With a few clicks of the mouse, an unetched sample can be completely analyzed for graphite size, form, nodularity, and distribution.
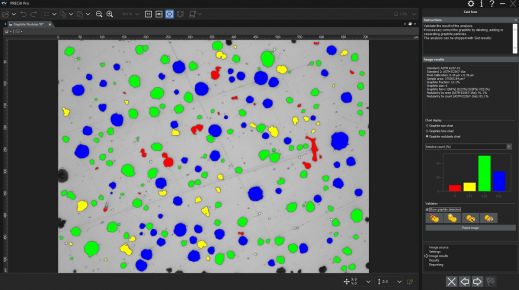
Detailed graphite analysis results are obtained quickly and accurately via image analysis software
After the graphite analysis is complete, the image analysis software automatically calculates the percentage of graphite, also known as the graphite fraction. This graphite fraction is used when analyzing the pearlite-to-ferrite ratio of an etched sample. The graphite fraction helps operators distinguish between graphite and pearlite, because their similar grayscale values make them indistinguishable from one another in image analysis software.
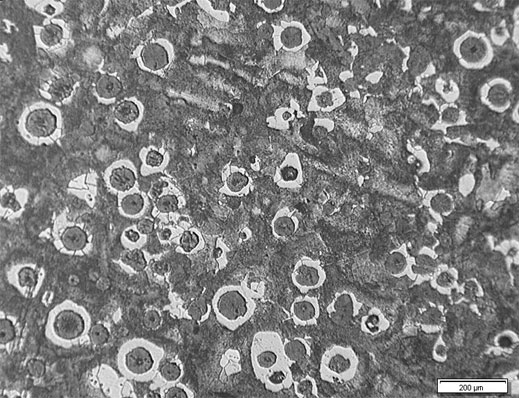
Example of an etched sample where the ferrite-to-pearlite ratio can be calculated
Once the analysis is complete, all data is written directly into a results spreadsheet within the image analysis software. Reports containing relevant analysis data and associated images can also be generated at the push of a button, all with minimal training.
Recommended Imaging Equipment for Cast Iron Analysis
A typical equipment configuration for analyzing cast iron through digital image analysis consists of the following components:
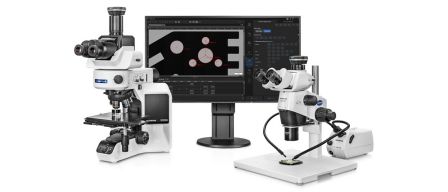
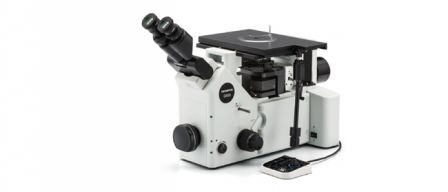
1. Inverted Metallurgical Microscope
An inverted microscope is typically preferred over an upright model because the flat, polished sample lays flat on the mechanical stage. This helps ensure consistent focus as the user maneuvers the scanning stage.
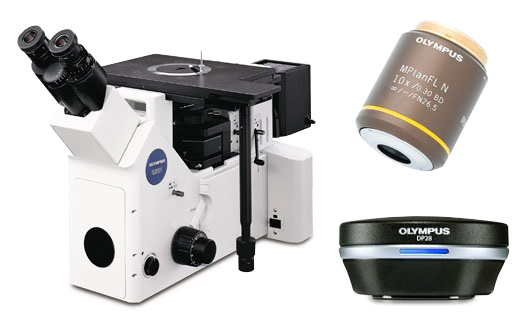
Typical equipment configuration: inverted metallurgical microscope, 10X metallurgical objective lens, and high-resolution digital microscope camera
2. Metallurgical-Specific Image Analysis Software
Image analysis software for materials science applications often offers optional add-on modules that enables users to analyze cast iron directly in compliance with ASTM A247, as well as various international standards.
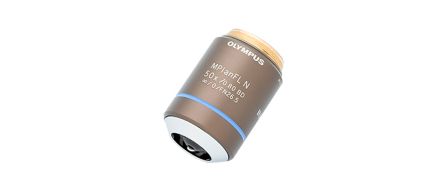
3. 10X Metallurgical Objective Lens
This is the required objective magnification for cast iron analysis.
4. High-Resolution CCD or CMOS Digital Microscope Camera
When considering a digital microscope camera for cast iron analysis, the pixel size, or resulting pixel density, is more important than digital resolution. To ensure enough pixels are provided to sample and digitally reconstruct the smallest detail, many microscopists follow the Nyquist Theorem. This theorem states that 2 to 3 pixels are required to sample the smallest detail, or optical resolution. Considering that cast iron analysis is always performed with a 10X objective lens (coupled with 10X eyepieces = 100X total magnification), the optical resolution of a typical mid-grade objective lens would be approximately 1.1 μm. This means that the actual, calibrated pixel size must be smaller than 366 nm (providing the required 3 pixels per smallest distinguishable feature).
For example, an 8.9-megapixel camera with a 3.45 μm pixel size yields a calibrated pixel size of 345 nm (dividing the actual pixel size by the 10X objective lens, using a 1X camera adapter). Dividing the lens resolution (1.1 μm) by the calibrated pixel size (345 nm) = 3.2. In this example, 3.2 pixels are present to sample the smallest distinguishable feature, meeting the Nyquist criteria of 2 to 3 pixels per distinguishable feature. In general, most microscope cameras for materials science with a 3-megapixel or greater rating (considering the pixel size of most common CCD and CMOS sensors) are recommended for cast iron analysis.
Because cast iron analysis can be adequately performed in grayscale mode (where setting the threshold parameters is simpler than color mode), the chosen camera should have the grayscale mode option. Also, choosing a camera that can achieve a fast refresh rate in live mode will help when focusing or positioning the sample.
A coded manual or motorized revolving objective nosepiece is recommended. The chosen image analysis software should be capable of automatically reading the objective lens magnification at all times. This helps ensure the highest level of measurement accuracy, as automatic recognition helps eliminate the risk of manually entering the incorrect objective lens magnification into the software.
A manual or motorized XY scanning stage is required to manipulate the sample and position the area of interest for observation and analysis. The PC that you choose should meet the minimum system requirements of the camera and image analysis software. Ahigh-resolution monitor is also required.
Procedure for Cast Iron Analysis
Using the recommended metallurgical equipment, here is the typical procedure to perform the cast iron analysis:
- Select the 10X objective lens.
- Under reflected light and brightfield conditions, maneuver the sample on the XY stage to view the area of interest.
- Capture the digital image via the image analysis software. Note: If the software platform offers the ability to analyze a live image, you can observe the live image instead.
- Perform the image analysis:
a. Graphite analysis: Set the grayscale threshold levels so that the graphite is detected on the unetched sample. If required, modify the particle results (split, connect, draw, or delete the graphite nodes). The percentage of graphite, or the graphite fraction, is memorized and used in the subsequent ferrite-to-pearlite analysis.
b. Ferrite-to-pearlite analysis: Set the grayscale threshold levels so that the ferrite is detected. Since graphite and pearlite possess similar grayscale values, the percentage of graphite from the graphite analysis is considered. A morphological filter can be applied before the analysis to separate bright voids in the pearlite from being erroneously detected as ferrite.
c. The image is analyzed in compliance with the chosen standard. The resulting data is written directly into a spreadsheet within the image analysis software. - Based on the user's predefined template, the software automatically generates a report that incorporates the analysis results, supporting cast iron images, and relevant data.
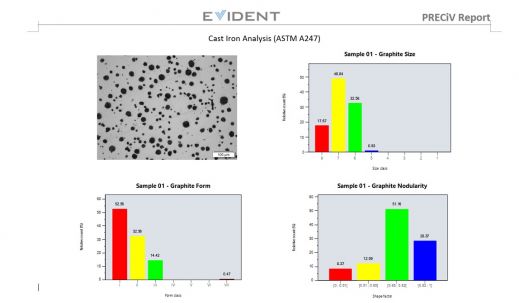
Example of an automatically generated report including relevant images and analysis results
Other Ways to Streamline the Cast Iron Analysis Process
Unlike former techniques where operators performed a visual estimation of the graphite size, nodularity, form, or distribution manually by eye, modern image analysis software for materials science applications enables the graphite parameters to be calculated accurately and repeatedly, as operator intervention is minimized. Many software packages are designed to comply with ASTM A247 and a wide range of international standards, and they can be implemented with minimal efforts. Going beyond the scope of the metal grain structure analysis, many software programs offer convenient connectivity, reporting, and data management capabilities to save time. Software with automatic report generation, data archiving and sharing, and quick searches of images and related data can make your team more efficient. When considering a turnkey solution for automatic cast iron analysis, working directly with an experienced microscope manufacturer is highly important, as they can assist you in every step of this process, from equipment selection to full deployment.
Note: Nodularity in cast iron can also be measured ultrasonically, without the need for surface preparation. Further details can be found here.
References
Carmo Pelliciari, Dr. Eng., Metallurgical Consultant
Miguel Angel Yescas-Gonzalez and H. K. D. H. Bhadeshia, University of Cambridge
American Society for Testing and Materials (ASTM) A247 Standard
ASTM International, 100 Barr Harbor Drive, PO Box C700, West Conshohocken, PA, 19428-2959 USA