To design sturdier structures and avoid failure of existing ones, engineers need to thoroughly understand the relationship between load application and fatigue-related degradation. In this case study, engineers at EWI tested and determined that using full matrix capture (FMC) and total focusing method (TFM) imaging can provide deeper insights into crack growth caused by fatigue loading.
Cyclic loading is when structures are repeatedly subjected to varying mechanical forces, strain, tension, and stress. Bridges, cranes, aircraft wing spars, and power generation turbines are prime examples of cyclically loaded structures. At EWI, standard laboratory testing is conducted on samples made of materials used to construct these structures to study the impacts of cyclic loading over time. The data collected enables the calculation of crack growth rates, which are used for engineering assessments of a structure’s remaining service life.
In this case study, however, it is not the samples that were the subject, but the tools used to evaluate them. To ensure they have the most effective and efficient evaluation tools at their disposal, the EWI nondestructive testing team also examine the latest advances in NDT instruments in their lab. TFM is an advanced imaging method in the field of phased array ultrasonic testing (PAUT). EWI tested TFM on a simulated fatigue crack, comparing it to conventional phased array.
EWI
EWI is an advanced engineering service provider based in Columbus, Ohio. Its nondestructive evaluation (NDE) group continually updates its capabilities to include state-of-the-art techniques to develop inspection and assessment procedures for bulk materials and components, assuring the highest standards of quality.
Testing the Efficacy of the Total Focusing Method (TFM) for Imaging Cracks
In standard laboratory fatigue tests, engineers measure the propagation of a crack in a specimen over time at intervals to record and analyze the growth rate. Analyzing fatigue crack growth rate is complex. It is influenced by the specimen material, the geometry, environmental factors such as corrosion, etc., so the more accurate and thorough the data that engineers have, the better. The goal of this experiment was to determine whether TFM provides information that could be useful to furthering this analysis.
A common tool used to monitor fatigue cracking is the clip gauge. The clip gauge is inserted in the mouth of the crack, and it measures changes in the compliance of the specimen. In this experiment, EWI used a clip gauge as a base comparison for the TFM and PA acquired data. The equipment used for the fatigue test is listed below, and the initial setup is shown in Figure 1.
Fatigue Test Setup
Required Materials and Equipment
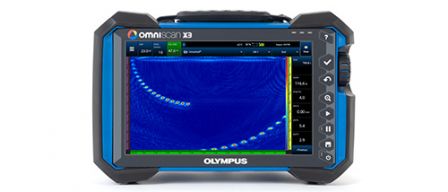
- OmniScan™ X3 flaw detector
- Olympus 7.5L60 PWZ1 7.5 MHz linear array probe
- Rexolite SPWZ1 N55S wedge
- 50 kip servo-hydraulic test frame
- FlexTest GT Controller 35C 1815
- MTS 5 mm clip gauge model 632.02F-21
- Single-edge notched bend (SENB) fracture toughness specimen (ASTM E1820)
Specimen dimensions:
- 300 mm (11.8 in.) long
- 40 mm (1.6 in.) wide
- 45.9 mm (1.8 in.) high
Starter notch generated by electro-discharge machining (EDM)
- 11.2 mm (0.44 in.) deep
- 1 mm (0.04 in.) wide
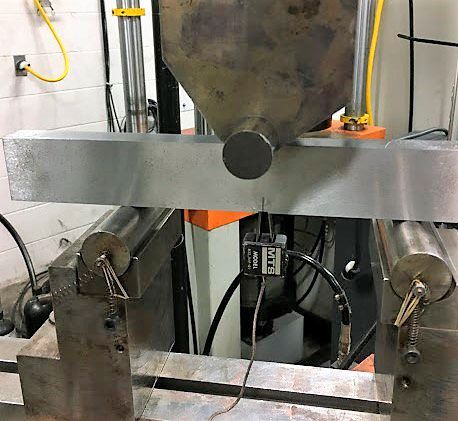
Figure 1 — SENB specimen on the servo-hydraulic three-point bend rig (i.e., three rollers, two on the bottom and one on top) with the MTS clip gauge inserted in the starter notch
Simulating Cyclic Loading Fatigue Crack Growth
To initiate fatigue cracking for the test, cyclic loading was applied to the SENB specimen with the loading concentrated on the center roller over the starter notch. The loads were applied at a range of 5 to 10 hertz, based on the force that the engineers calculated was required to generate the desired fatigue crack growth without causing unwanted deformation.
During the cyclic loading process, measurements of the crack’s growth were taken at 20 to 30 minute intervals using the clip gauge and the OmniScan™ X3 flaw detector and probe and wedge setup (Figure 2). Before beginning the loading cycles, images were acquired of the machined notch for comparison (Figure 4 and Figure 5).
To evaluate and compare the effectiveness of the ultrasonic testing method, the following acquisition approaches were used (Figure 3):
- Conventional phased array sectorial scan
- Full matrix capture (FMC) and TFM in TT mode and TT-T mode
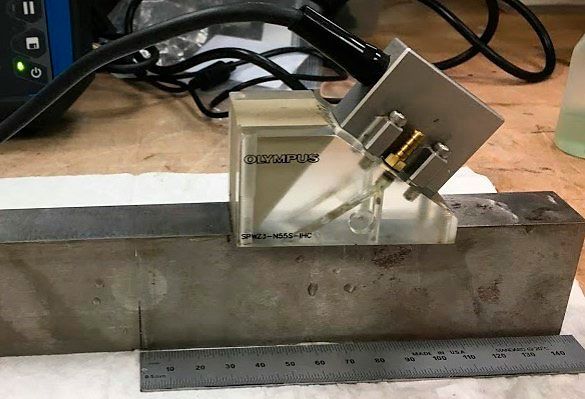
Figure 2 — Olympus linear array probe installed on a Rexolite wedge on the SENB specimen
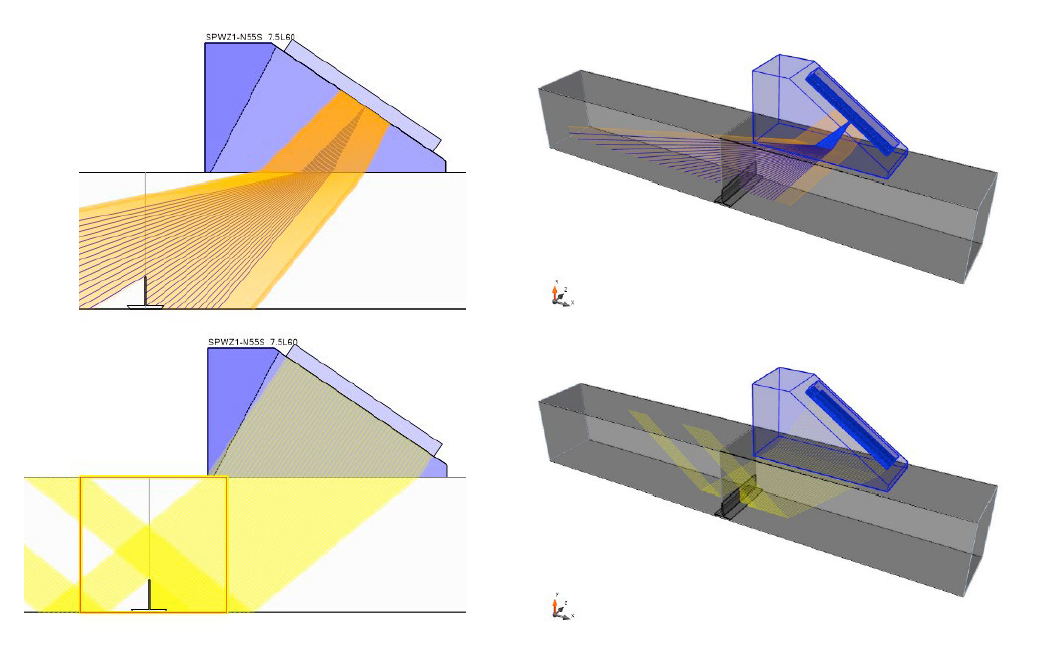
Figure 3 — Phased array sectorial scan (top left and right) and FMC/TFM scan (bottom left and right)
The test engineers ensured that the OmniScan™ X3 flaw detector’s pulse-echo mode sensitivity was high enough to optimally detect faint diffraction signals from the fatigue crack.
Table 1- Crack length measurements taken at intervals during cyclic loading simulation
| Interval | Number of cycles | Clip gauge crack length (mm) | TFM crack length (mm) | Phased array crack length (mm) |
|---|---|---|---|---|
| 1 | 44914 | 11.88 | 12.38 | 12.61 |
| 2 | 66953 | 14.05 | 16.94 | 17.03 |
| 3 | 109833 | 20.25 | 22.17 | 21.77 |
| 4 | 129476 | 23.12 | 25.02 | 24.09 |
| 5 | 150378 | 26.22 | 26.83 | 27.08 |
The crack length measurement data obtained at each interval for all methods is available in Table 1. While imaging was acquired at all intervals, only the PA and TFM images for the third and fifth intervals are shown here (Figure 6 to Figure 9) for reference
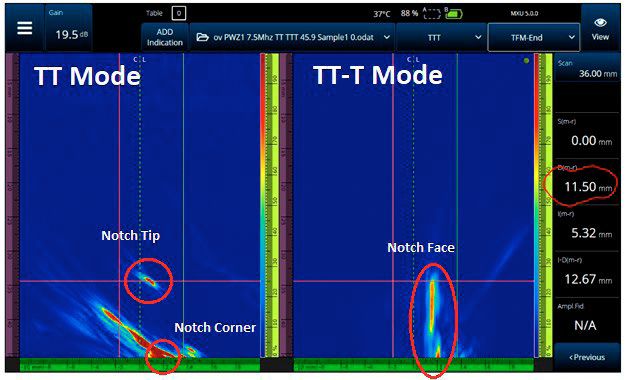
Figure 4 — TT mode (left) and TT-T mode (right) images for cycle 0
![]()
Figure 5 — PA sectorial scan image for cycle 0
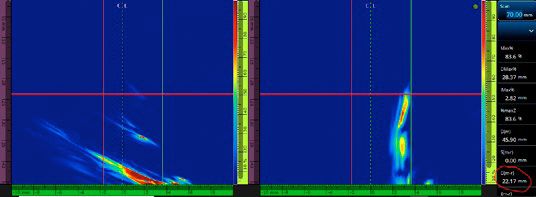
Figure 6 — TT mode (left) and TT-T mode (right) images for cycle 109833
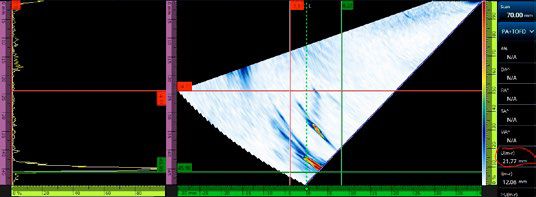
Figure 7 — PA sectorial scan for cycle 109833
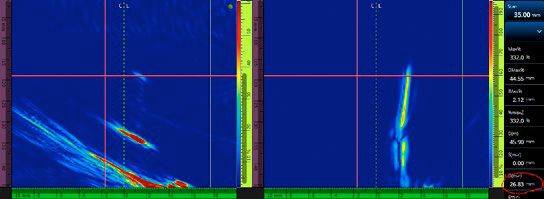
Figure 8 — TT mode image (left) and TT-T mode (right) image for cycle 150378
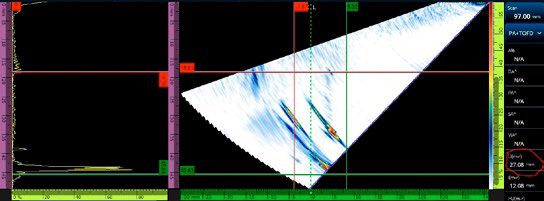
Figure 9 — PA sectorial scan image for cycle 150378
When the loading cycles were complete, the specimen was cut open to measure the crack manually (Figure 10). To achieve greater accuracy, several measurements were taken, and then these measurements were averaged. A comparison of the final measurements of the generated fatigue crack is provided in Table 2.
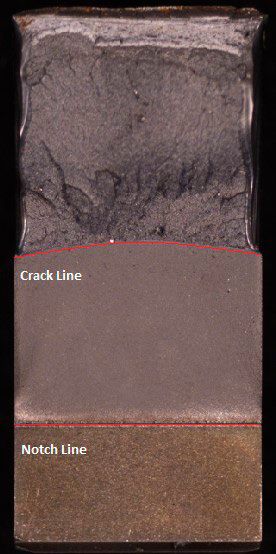
Figure 10 — Cross-section of the notch and crack in the specimen
Table 2 — Comparison of TFM, PA, and clip gauge to manual visual measurement of the fatigue crack
| Manually measured crack length (mm) | Clip gauge crack length (mm) | TFM crack length (mm) | Phased array crack length (mm) |
|---|---|---|---|
| 26.89 | 26.22 | 26.83 | 27.08 |
| % difference from manual measurement | −2.5 | −0.2 | +0.7 |
Conclusions Concerning the Advantages of TFM
Regarding accuracy, the EWI engineers concluded that the TFM method was reliable in that it achieved a value that was nearly the same as the manually measured value (Table 2). It was also noted that TFM was slightly more accurate than PAUT and the compliance-based clip-gauge methods (Volf 2020). These results mean that TFM shows good potential as an alternative to the clip gauge for plotting the growth rate of cracks. However, where the real advantage arises is that TFM is a nondestructive way to view the crack and gain valuable information on its nature and orientation (angle, degree of branching, etc.). The easy-to-interpret visual representation of the crack provided by TFM helps reduce the complexity of the data analysis (Figure 11), easing comprehension.
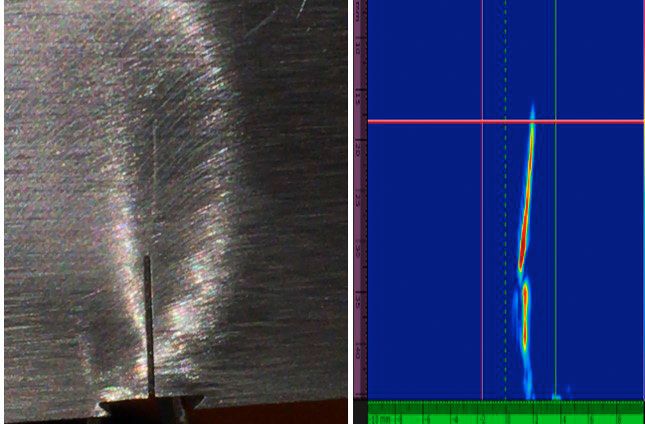
Figure 11 — Photo of the crack projecting upward from the notch (left); TFM image of the notch and crack (right)
The EWI engineers propose performing further testing of TFM on crack geometries such as corner, branched, and buried cracks. Additional experimentation is needed to confirm this study’s perceived potential to improve fatigue crack detection, sizing, and characterization, which could ultimately improve the accuracy of service life assessments of cyclically loaded structures.
Reference
Volf, Oleg. EWI Technical Insights. “Crack Growth Monitoring with Phased-Array Total Focusing Method (TFM).” July 2020