Interpreting Sector Scans
In the case of swept angle sector scans, interpretation can be more complex because of the possibility of multiple leg signals that have reflected off the bottom and top of the test piece. In the first leg (the portion of the sound path up through the first bounce off the bottom of the part), the display is a simple cross-sectional view of a wedge-shaped segment of the test piece. However beyond the first leg, the display requires more careful interpretation, as it also does when using a
conventional flaw detector.
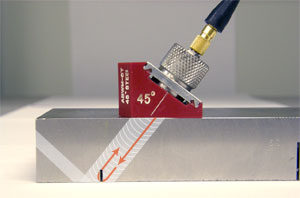
A conventional flaw detector used with common angle beam assemblies displays a single-angle A-scan. Modern digital instruments will use trigonometric calculation based on measured sound path length and programmed part thickness to calculate the reflector depth and surface distance. Part geometry may create simultaneous first leg and second leg indications on the screen, as seen here in the case below with a 5 MHz transducer and a 45 degree wedge, where a portion of the beam reflects off the
notch on the bottom of the part and a portion reflects upward and off the upper right corner of the block. Leg indicators and distance calculators can then be used to confirm the position of a reflector.
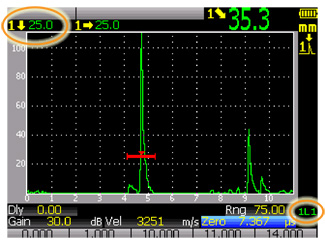
The first leg indication is a large reflection from the notch on the bottom of the test block, The depth indicator (upper left of screen image) shows a value corresponding to the bottom of a 25 mm thick block, and the leg indicator (lower right of screen image) shows that this is a first leg signal.
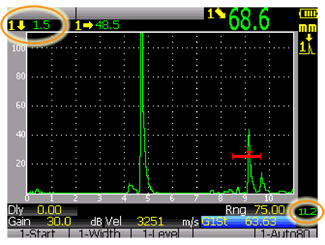
The second leg indication is a small reflection from the upper corner of the block. The depth indicator shows a value corresponding to the top of a 25 mm thick block, and the leg indicator shows that this is a second leg signal. (The slight variation in depth and surface distance measurements from the expected nominal values of 0 and 50 mm respectively is due to beam spreading effects).
When the same test is performed with a 5 MHz phased array probe assembly, scanning from 40 to 70 degrees, the display shows a sector scan that is plotted from the range of angles, while the accompanying A-scan typically represents one selected angular component of the scan. Trigonometric calculation uses the measured sound path length and programmed part thickness to calculate the reflector depth and surface distance at each angle. In this type of test, part geometry may create simultaneous
first leg and second leg indications on the screen as well as multiple reflectors from a single angle. Leg indicators in the form of horizontal lines overlayed on the waveform and image segment the screen into first, second, and third leg regions, while distance calculators help confirm the position of a reflector. Those distances are typically presented as follows:
In this example we see three indications from a single probe position as the beam sweeps through a 40 degree to 70 degree scan.
Continue on to
Phased Array Glossary>>